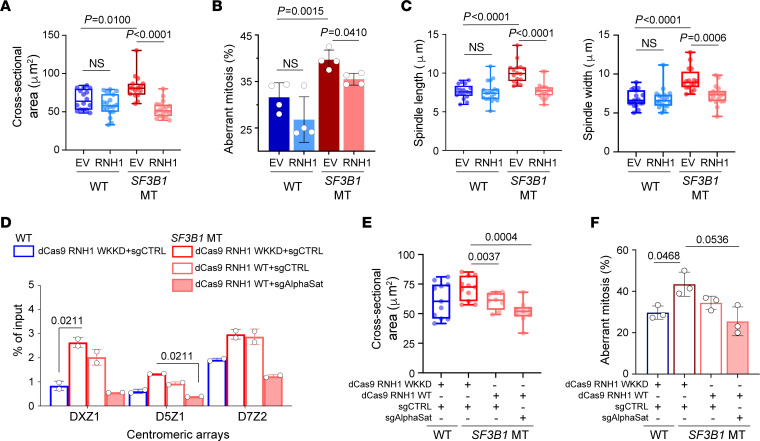
Figure 3. SF3B1 mutation–associated cen-R-loop dysregulation leads to aneuploidy.
(A–C) Analysis of 2-dimensional cross-sectional area of the entire body of chromosomes (A) and aberrant mitosis frequency (B) and spindle length and width (C) in HEK293T SF3B1 WT and MT overexpressing either empty vector (EV) or WT RNH1. (D) DRIP-qPCR in HEK293T SF3B1 WT and MT overexpressing either dCas9–GFP–RNaseH1 WKKD (WKKD RNH1) or dCas9–GFP–RNaseH1 WT (WT RNH1) in combination with either sgRNA guide control (sgCTRL) or sgRNA targeting α-satellite centromeric repeats (sgAlphaSat). Centromeric arrays: The chromosome is specified by the number following the “D”; and the array is specified by the number following the “Z.” Two-way ANOVA test. (E and F) Analysis of 2-dimensional cross-sectional area of the entire body of chromosomes (E) and aberrant mitosis frequency (F) in cells from D. Box plots show the median and 25th and 75th percentiles, with whiskers extending to minimum and maximum values. Bar graphs represent mean ± SD. Each dot represents a biological replicate. Two-tailed unpaired t test followed by Bonferroni’s post hoc test, except in D.

