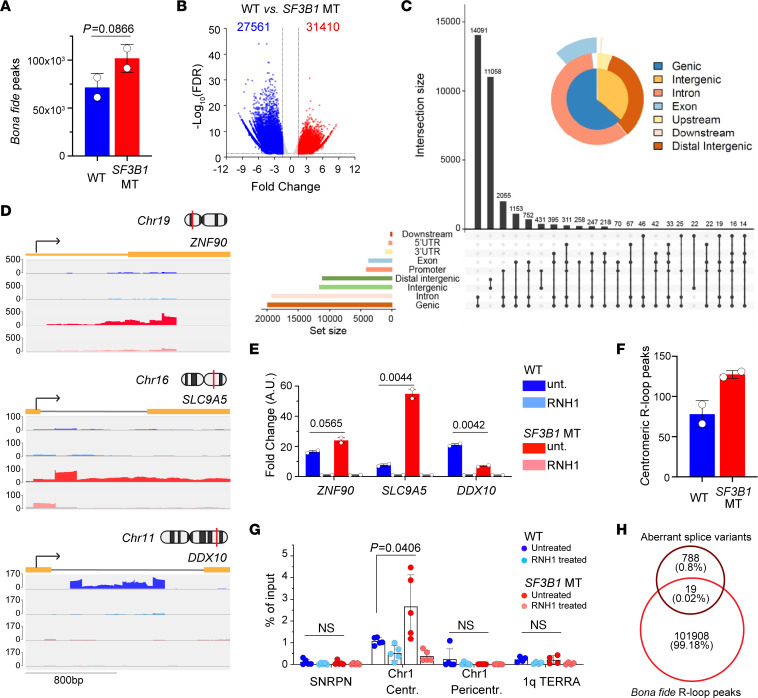
Figure 4. SF3B1 mutation–associated R-loops have minimal overlapping with splice variants.
(A) Quantification of genome-wide bona fide R-loops in Nalm-6 WT and SF3B1 MT detected by DRIP-seq. (B) Volcano plot of differential bona fide R-loops between SF3B1-MT and -WT cells. Significant differential peaks cutoff as FDR < 0.05 and fold change > 1.5. (C) Genomic distribution of differential upregulated bona fide R-loops associated with SF3B1 mutation with UpSet and PieChart plots. Intersection size indicates the number of R-loops. The black dots connected with lines represent overlapped R-loops. (D) Integrative Genomics Viewer (IGV) of R-loops profiled by DRIP-seq over indicated upregulated and downregulated genes. (E) Validation of differential R-loop peaks in D by DRIP-qPCR assay. RNH1 treatment is included as background control. Graphs represent qPCR results of biological duplicates; fold change over paired RNH1 treatment is presented as mean ± SEM; 2-tailed unpaired t test. (F) Quantification of centromeric bona fide R-loops detected by DRIP-seq. (G) SF3B1 mutation–associated cen-R-loops validated using DRIP-qPCR in mitotic cells with and without SF3B1 mutation. Chromosome 1 (Chr1) centromere, pericentromere, and telomeric 1q TERRA regions tested for R-loop accumulation. SNRPN was used as negative control. RNH1-treated samples were used as an R-loop background control. Graphs represent qPCR results expressed as percentage of input mean ± SEM. Dots represent technical replicates of 2 biological replicates. (H) Venn diagram demonstrates overlap between Nalm-6 SF3B1 MT–associated alternative splice variants and bona fide R-loop peaks in WT (blue) and MT (red) SF3B1.

