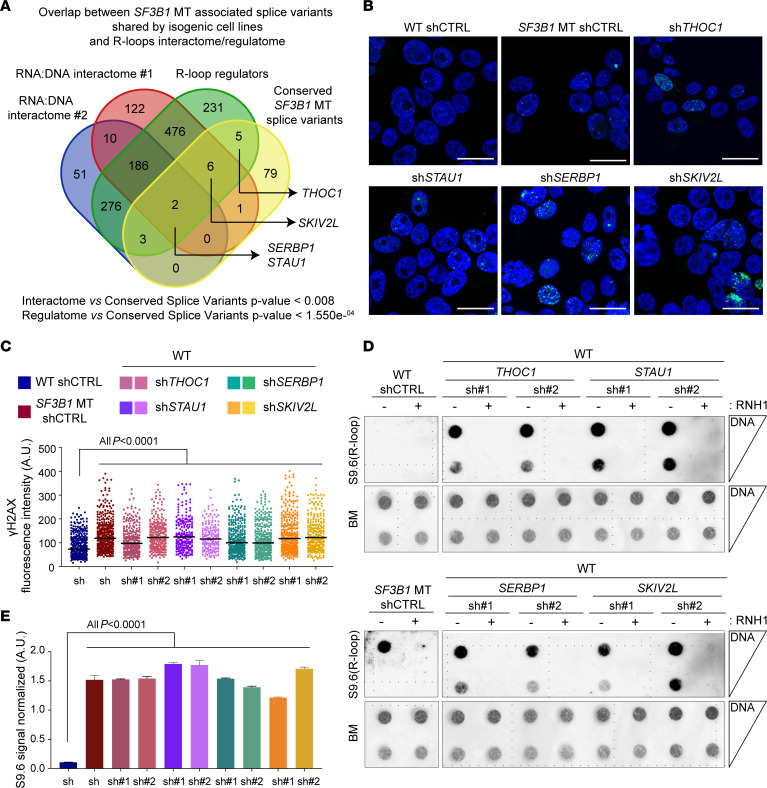
Figure 5. R-loop accumulation is induced by SF3B1 mutation–associated loss-of-function alternative splice variants.
(A) Venn diagram of overlapped conserved splice variants among SF3B1-MT isogenic cell lines (HEK293T, K562, and Nalm-6; Supplemental Table 1); DNA:RNA hybrid interactome in human cell studies: interactome #1 (26), interactome #2 (21, 28), and R-loop regulatory proteins data set (27). Hypergeometric distribution test. (B–E) Representative images of γH2AX foci immunofluorescence staining (B), R-loops detected by dotblot analysis (D), and relative quantification (C and E) in HEK293T cells with silencing of THOC1, STAU1, SERBP1, and SKIV2L genes. γH2AX foci are pseudocolored in green, nuclei in blue. Scale bars: 20 μm; >100 cells were analyzed for each group. Mean ± SD is plotted. Two-tailed unpaired t test. For R-loops, serial dilutions starting from 500 ng DNA. Blue methylene (BM) staining was used as loading control. Bars represent mean ± SD of S9.6 signal quantification normalized on relative BM. One-way ANOVA test.

