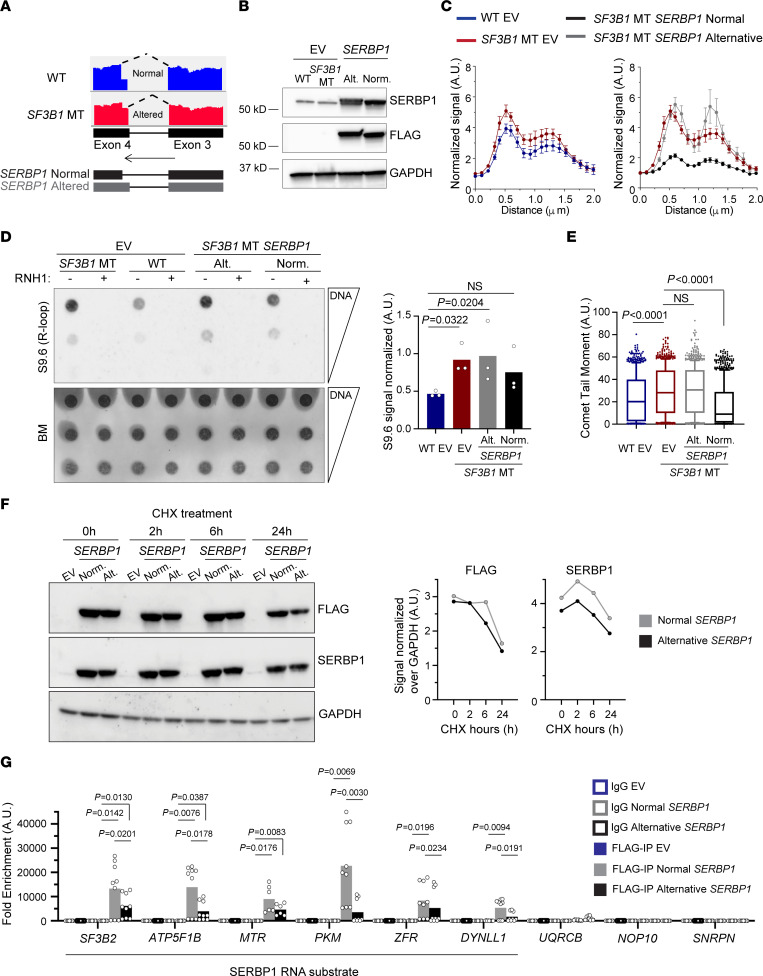
Figure 6. SF3B1 mutation modulates R-loop metabolism through SERBP1 alternative splicing.
(A) IGV of RNA-Seq reads covering the cryptic 3′ splice site of the SERBP1 gene in SF3B1-WT and -MT Nalm-6 cells. (B) Immunoblots of HEK293T SF3B1-WT and -MT cells overexpressing either FLAG empty vector (EV) or SERBP1 FLAG-tagged isoforms. (C) Quantification of centromeric p-RPA immunofluorescence signal normalized to background near centromeres from cells described in B. SF3B1-MT EV cell line results are reported in 2 different graphs for better visualization. Wilcoxon’s paired test. HEK293T WT EV vs. SF3B1-MT EV, P < 0.0001; SF3B1-MT EV vs. SF3B1-MT SERBP1 normal isoform, P < 0.0001; SF3B1-MT EV vs. SF3B1-MT SERBP1 alternative isoform, P = NS. The number of chromosomes quantified ranges from 39 to 50. (D) Representative R-loops (left) and relative quantification (right) from dotblot assay in cells from B. Bars represent mean; dots represent biological replicates. One-way ANOVA comparison test. (E) Alkaline comet assay in cells as in B. Box plots show the median and 25th and 75th percentiles, with whiskers extending to minimum and maximum values. One-way ANOVA Dunnett’s multiple test. Comets quantified range from 783 to 995. (F) Left: Representative immunoblot of HEK293T cells as in B, treated for the indicated times with cycloheximide (CHX). Right: FLAG and SERBP1 immunoblot quantification normalized over GAPDH. (G) eCLIP-qPCR performed with HEK293T cells transfected as in B. SF3B2, ATP5F1B, MTR, PKM, ZFR, and DYNLL1 were selected based on SERBP1 predicted mRNA target and R-loop–forming genes associated with SF3B1 mutation. SNRPN, NOP10, and UQRCB were selected as negative controls.

