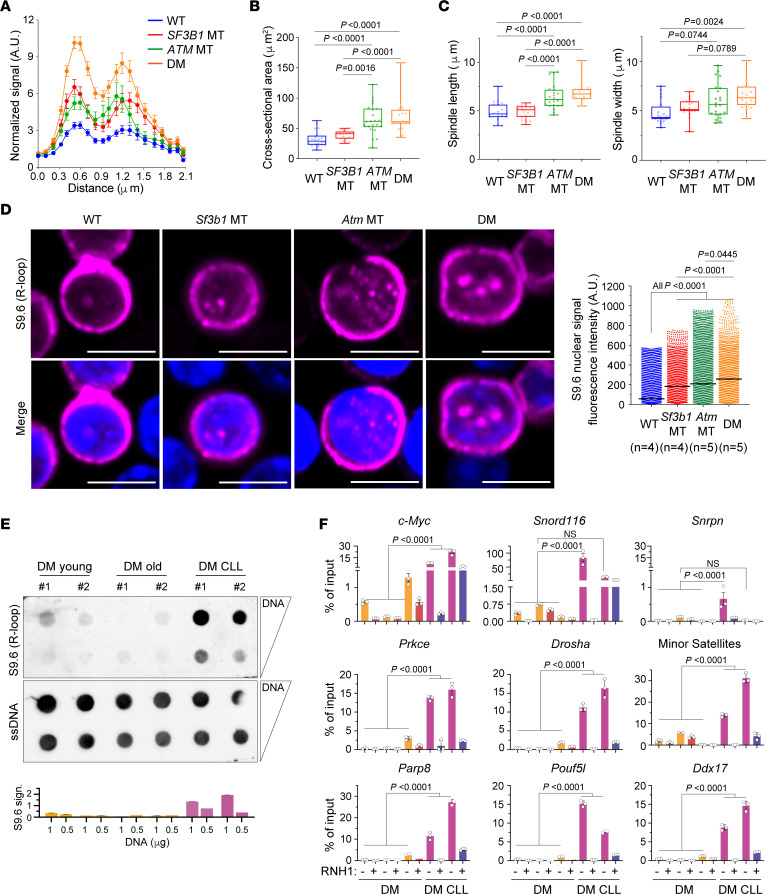
Figure 8. R-loop accumulation is a feature of murine CLL with Sf3b1 mutation and Atm deletion.
(A) Quantification of centromeric p-RPA signal in Nalm-6 Cas9 SF3B1-WT and -MT cells with and without ATM knockdown. Two-tailed paired t test, Nalm-6 WT vs. SF3B1 MT, or vs. ATM MT, or vs. DM, P < 0.0001; ATM MT vs. DM, P < 0.0001; SF3B1 MT vs. DM, P < 0.0001. The number of chromosomes quantified ranges from 56 to 113. (B and C) Quantification of 2-dimensional cross-sectional area of the entire body of chromosomes (B) and spindle length and width (C) in metaphases of cells described in A. Box plots show the median and 25th and 75th percentiles, with whiskers extending to minimum and maximum values. Dots represent biological replicates. Two-tailed unpaired t test followed by Bonferroni’s post hoc test. (D) Left: Representative images of R-loops detected by IF with S9.6 antibody (red) in WT, Sf3b1-MT, Atm-deleted (MT), and Sf3b1-MT and Atm-deleted (DM) murine splenic B cells. Scale bars: 5 μm. Right: Quantification of S9.6 nuclear fluorescence intensity. Number of mice used for each genotype is indicated. The number of cells quantified ranges from 2135 to 3690. Center lines show the medians. Two-tailed unpaired t test followed by Bonferroni’s post hoc test. (E) Top: Dotblot assay using splenic B cells derived from DM mice without and with CLL. Bottom: Relative S9.6 signal quantification normalized over ssDNA signal. Each bar represents 1 biological replicate. (F) DRIP-qPCR analysis of R-loop enrichment over negative (Snrpn) and positive (c-Myc, Snord116) loci for R-loop accumulation, over representative genes (Prkce, Drosha, Ddx17, Parp8, Pouf5l, and Akt) and centromeric regions (minor satellites), in normal and CLL B cells derived from DM mice. RNH1 treatment is included as control. Data are presented as mean ± SEM (n = 3, technical replicates). One-way ANOVA Tukey’s test. Untreated vs. RNH1-treated is significant for all samples tested (P < 0.0001).

