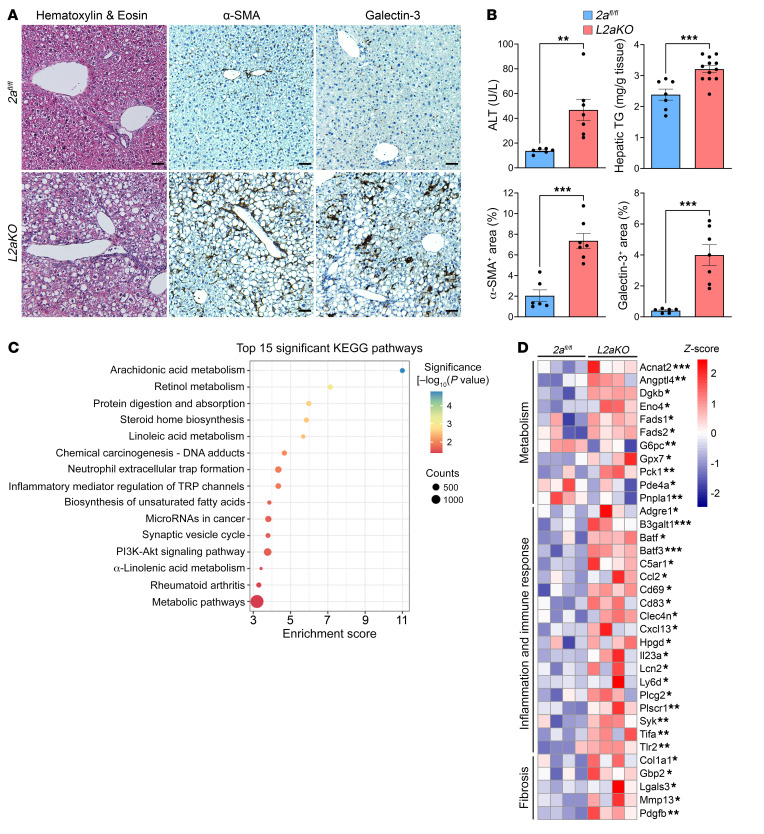
Figure 4. Mfsd2a deficiency results in diet-induced early onset steatohepatitis.
(A and B) Adult 2afl/fl and L2aKO mice were fed with a NASH diet for 2 weeks (TG assay: 2afl/fl, n = 7, L2aKO, n = 12; IHC quantification: 2afl/fl, n = 6, L2aKO, n = 7). Histological analysis was performed on liver sections using H&E, α-SMA, and galectin-3. Scale bars: 50 μm. Morphometry analysis quantified the percentage areas that were positively stained for each of the indicated markers. Data are represented as means ± SEM. **P < 0.01; ***P < 0.001, 2-tailed Welch’s t test. (C) Hepatic RNA-Seq analysis in 2afl/fl and L2aKO mice fed a NASH diet for 2 weeks (n = 4 per genotype). Bubble plot shows the top 15 significant KEGG pathways for DEGs. (D) Heatmap representing the DEGs involved in relevant biological processes. Data are represented as z score of median ratio counts. *P < 0.05; **P < 0.01; ***P < 0.001.

