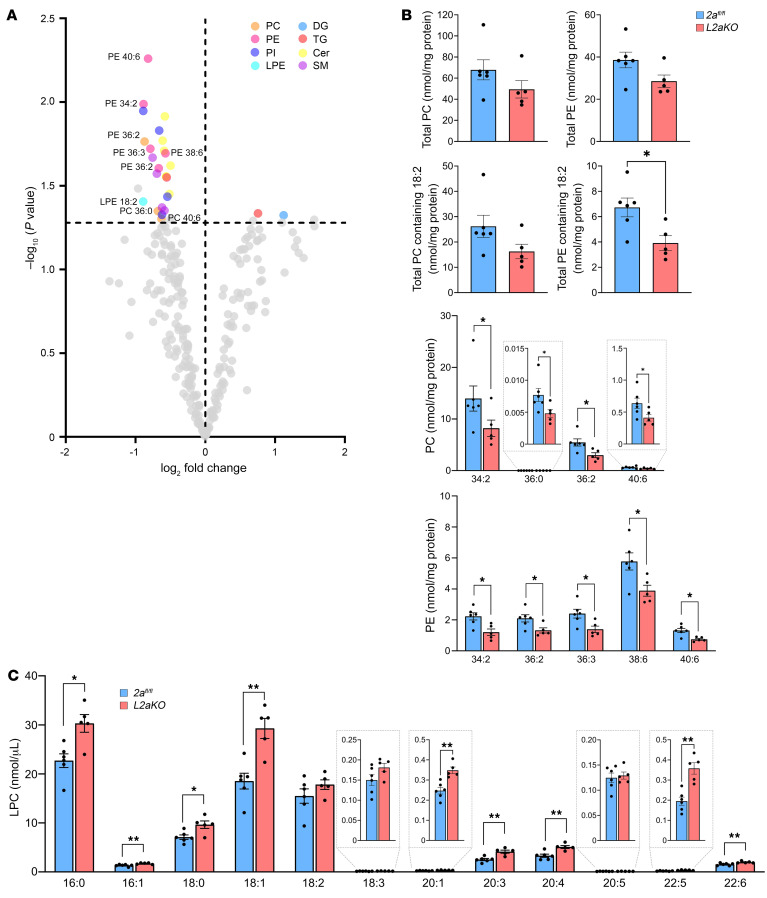
Figure 5. PC containing linoleate is reduced in NASH diet–fed L2aKO mice.
(A) Lipidomic analysis of livers from 2afl/fl (n = 6) and L2aKO (n = 5) mice fed with NASH diet for 2 weeks. Volcano plot showing the significantly changed lipid species in L2aKO as compared with 2afl/fl mice (colored dots represent significant species and are located above dashed line, indicating a threshold of P < 0.05). (B) Graphs showing total PC, total PE, total PC containing 18:2, total PE containing 18:2, and significantly changed specific PC and PE species. (C) Significantly changed LPC species in serum from 2afl/fl and L2aKO mice fed with NASH diet for 2 weeks. Data are represented as means ± SEM. *P < 0.05; **P < 0.01, 2-tailed Welch’s t test.

