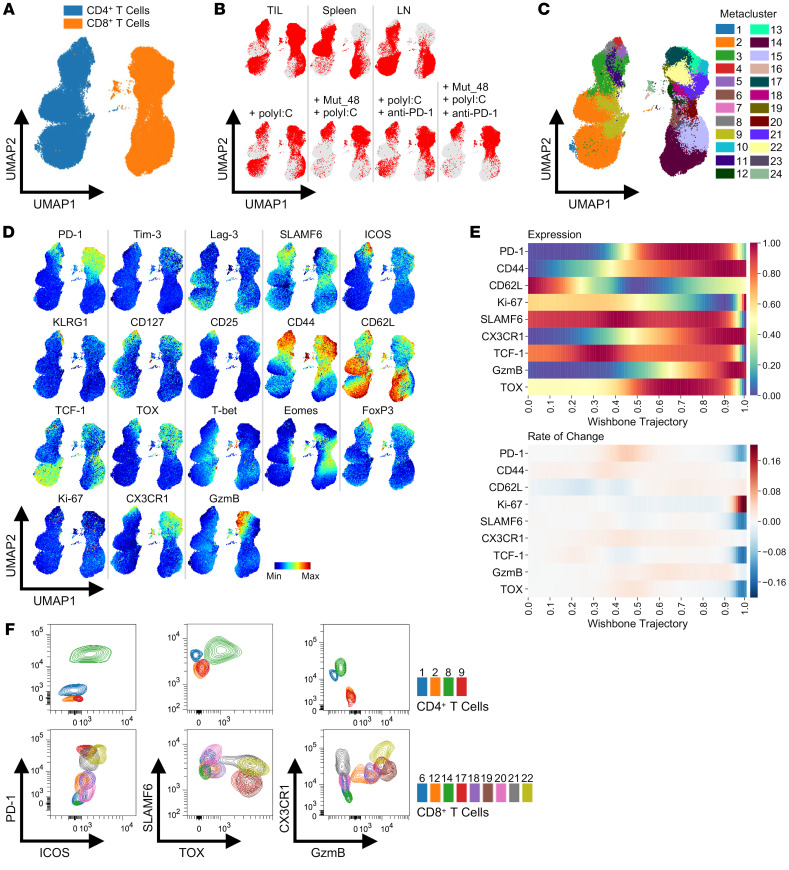
Figure 8. Identification of CD4+ and CD8+ T cell subsets in tumors and peripheral lymphoid organs.
C3H/HeJ mice injected with 5 × 10⁵ live SCC VII-Luc/GFP cells and given 50 μg polyI:C alone or in combination with 5 μg Mut_48 peptide at day 10 after challenge. Select groups of mice also received anti-PD-1 at days 10, 13, and 16. TIL, tumor-draining Ig LN, and spleens isolated from day 17 tumor-bearing mice gated on total CD4+ and CD8+ T cells (n = 5 per group). (A) High-dimensional FACS UMAP of all organs and treatments colored by CD4+ versus CD8+ T cell type with (B) total T cell positioning annotated by organ (upper panel) and TIL alone annotated by treatment (lower panel). (C) Identified T cell metaclusters and (D) expression profiles of selected phenotypic markers associated with each metacluster in UMAP space. (E) Pseudotime trajectory of CD8+ T cells using Wishbone analysis with CD8+ Tn (0.0 = start) to Tex-term and short-lived Teff (1.0 = end) differentiation displayed and branches in development converged. Distribution of CD62L (Tn and Tmem), TCF-1/SLAMF6 (Tprec/prog and Tmem), GzmB/CX3CR1/CD44/Ki-67 (Tex-int and Teff), and TOX/PD-1 (Tex-int and Tex-term) represented as expression (upper panel) and rate of change (lower panel). (F) Representative FACS profiles of metaclusters of interest from all organs converged. All experiments were performed 2 or more times.

