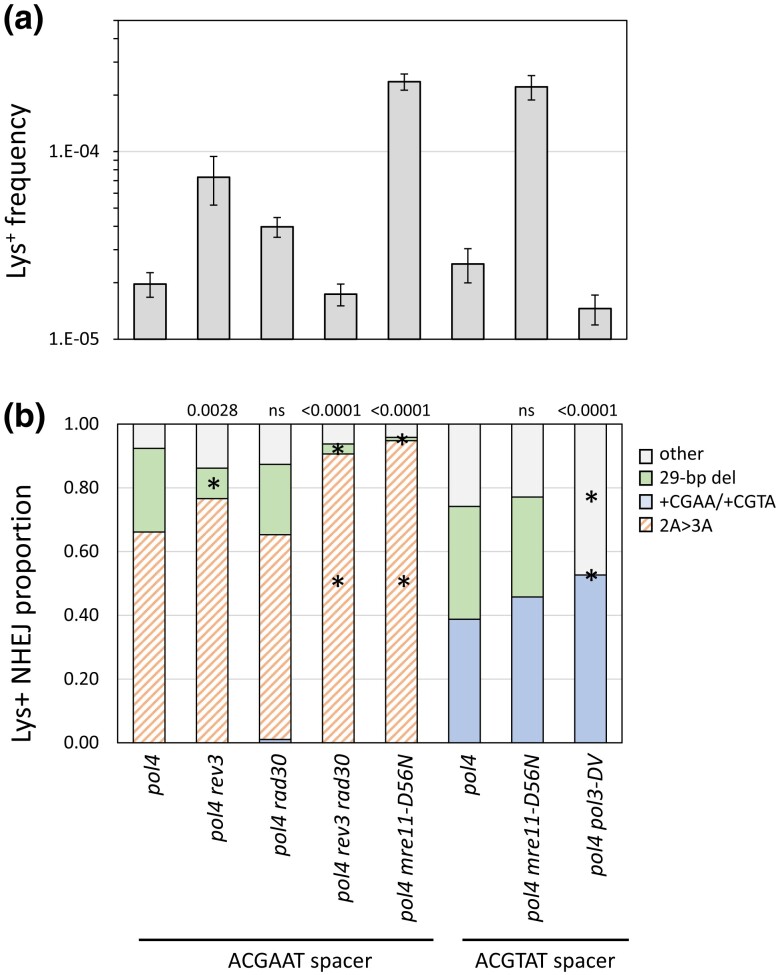
Fig. 4.
Genetic control of the Pol4-independent, 29-bp deletion. a) Mean frequencies of Lys+ colonies; error bars are 95% confidence intervals for the means. b) The overall distribution of the 3 major NHEJ types in each mutant background. With the ACGAAT spacer only the 2A > 3A, the 29-bp deletion, and random “other” events were observed; there were no 1T > 2T or +CGAA events. Changing the ACGAAT spacer to ACGTAT eliminated the 2A > 3A event, which was replaced by +CGTA. Each distribution was compared to the corresponding WT using a 2 × 3 contingency chi-square test (ns, not significant). If the global P-value (above each spectrum) was less than 0.05, individual mutation classes were compared using the Bonferroni correction to determine significance (P < 0.05/3); asterisks indicate a significant proportional increase/decrease.

