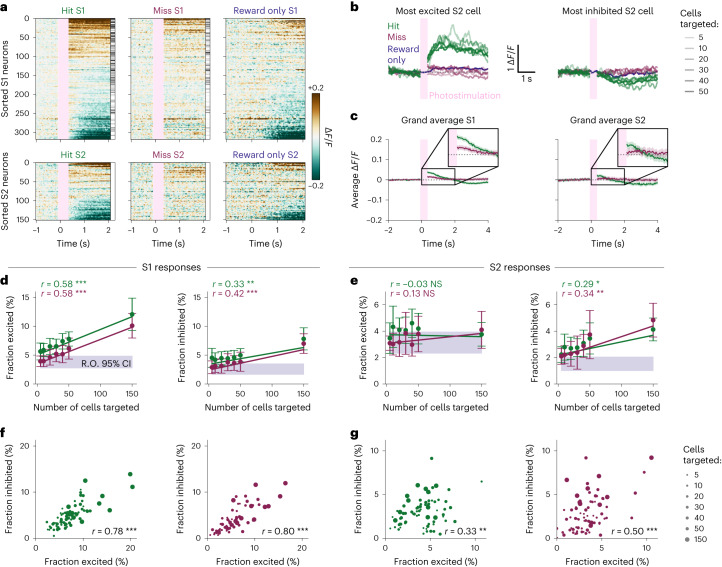
Fig. 2. Activity driven by targeted 2P photostimulation is propagated from S1 to S2.
a, Raster plots showing the trial-averaged response of different trial types (left: hit, middle: miss, right: reward only) to photostimulation (pink vertical bar: hit/miss) and/or reward (hit/reward only) of individual cells from a single session. (All trial types of all sessions are shown in Supplementary Figs. 1 and 2). Cells are sorted by the sum of their trial-averaged responses across all three trial types (Methods). Clear excitatory and inhibitory responses are elicited in S1 and S2 on hit trials that are not observed on miss trials or reward-only trials. The intensity of the grayscale bar on the right-hand side of the hit and miss rasters is proportional to the number of times each cell was directly targeted by the photostimulation beam, for hit and miss trials separately. Trials in which 150 cells were targeted were removed for display because their stimulation period is longer. Data are bound between −0.2 and +0.2 ΔF/F and blanked during the photostimulation (pink bar). b, Left: the ΔF/F activity traces of the most excited S2 cell (of the session of a) are shown, averaged across stimulus conditions. This S2 cell shows a large response on hit trials (green) but no response on miss trials (red) or reward-only trials (blue). The transparency of the line indicates the number of cells targeted in S1. Trials in which 150 cells were targeted were removed for display. Right: equivalent plot for the most inhibited S2 cell of a. c, The average population response to hit and miss trials across all sessions is shown (shaded areas show 95% confidence interval across trials of all sessions). Traces are averaged across cells, trials and sessions for a given trial type. Trials in which 150 cells were targeted were removed for display. The population responses of all other trial types are shown in Extended Data Fig. 3b,c. d, The neural response in S1 on hit and miss trials depends on the number of cells targeted in S1. Left: the fraction of excited cells (Methods) in S1 maps linearly to the number of cells targeted on both hit and miss trials. Right: the fraction of inhibited cells in S1 maps linearly to the number of cells targeted on both hit and miss trials. For hit and miss trials, data are presented as mean ± s.e.m. The shaded purple bar shows the 95% confidence interval across sessions of the fraction of excited or inhibited cells in S1 on reward-only trials. The linear fit was determined using weighted least squares, where the weights were the inverse variance of the trials that constituted a data point, and subsequently bound between their 25th and 75th percentiles to prevent extreme weight values. P values were computed using a two-sided t-test, where significance is indicated by ***P < 0.001, **P < 0.01, *P < 0.05 or NS (not significant). e, Equivalent panel for S1 responses. Left: There is no relationship between the fraction of excited cells in S2 and the number of cells targeted in S1 on hit trials or miss trials. The shaded purple bar shows the fraction of excited or inhibited cells in S2 on reward-only trials. Right: the fraction of inhibited cells in S2 maps linearly to the number of cells photostimulated in S1 on both hit and miss trials. f, The fraction of cells excited by photostimulation in S1 is highly correlated with the fraction of cells inhibited after photostimulation, both on hit trials (left) and on miss trials (right). The size of the circle indicates the number of cells photostimulated. The Pearson correlation coefficient is denoted by r, with significance indicated as before (two-sided t-test). g, The fraction of cells excited by photostimulation in S2 is correlated with the fraction of cells inhibited after photostimulation, both on hit trials (left) and on miss trials (right).

