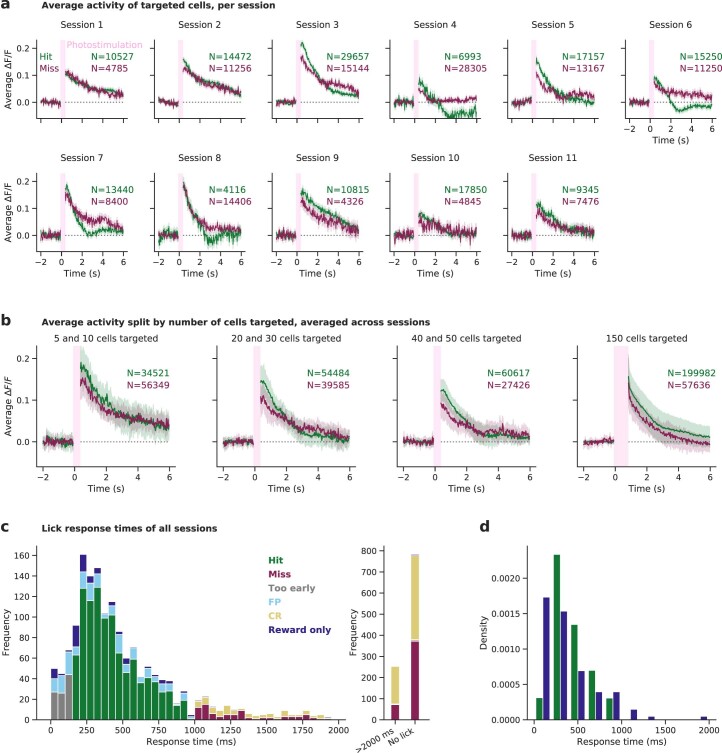
Extended Data Fig. 2. Activation of targeted cells by photostimulation.
(a) The average ΔF/F activity of the cells targeted by photostimulation is shown (mean values +/− SEM) per recording session, for Hit and Miss trials separately. Targeted cells are activated similarly, with the notable exception of Hit-only inhibition at ~2 seconds post-stimulus in 3 recording sessions (of the same animal), indicating that the photostimulation-induced activation is largely independent of behavioural outcome. All trials with 5 to 50 cells targeted were used; trials where 150 cells were targeted were excluded because almost all of these trials resulted in a Hit outcome, biasing the averages. (b) The same data as panel a) is shown, but now averaged across animals and split by number of cells targeted (mean values +/− SEM). (c) Stacked histogram of the animals’ response times (defined by the time of the first lick) for each trial type. All trials with a response time within 2000 ms of all recording sessions are shown in the left panel, while trials with a response time greater than 2000 ms and trials where no lick occurred are grouped in the right panel. (d) Density histograms of response times of hit and reward only trials. Same data as in panel a), but normalised per trial type and binned per 200 ms. Medians (248 ms for reward only trials and 383 ms for hit trials) are significantly different (p = 0.01, (two-sided) Mood’s median test).

