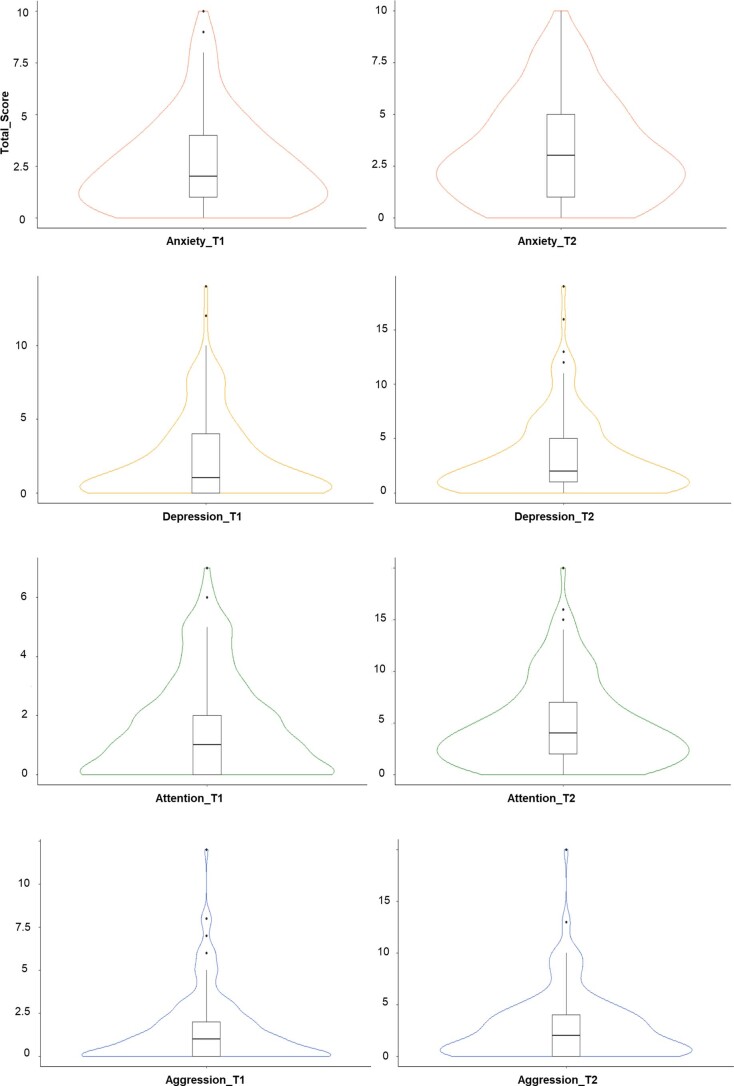
Extended Data Fig. 9. Psychopathology distribution in the MARS.
The plots depict the distribution of anxiety (T1: range: 0-10, median: 2; T2: range: 0-10, median: 3), depression (T1: range: 0-14, median: 1, T2: range: 0-19, median: 2), attention (T1: range: 0-7, median: 1, T2: range: 0-20, median: 4) and aggression (T1: range: 0-12, median: 1, T2: range: 0-20, median: 2) at both time points (T1: n = 169, T2: n = 114). Box limits indicate the range of the central 50% of the data, with a central line marking the median value and whiskers extending a maximum of 1.5 times the Interquartile Range from the upper (75%) and the lower (25%) quartiles. Outliers beyond the whiskers are represented as individual data points.

