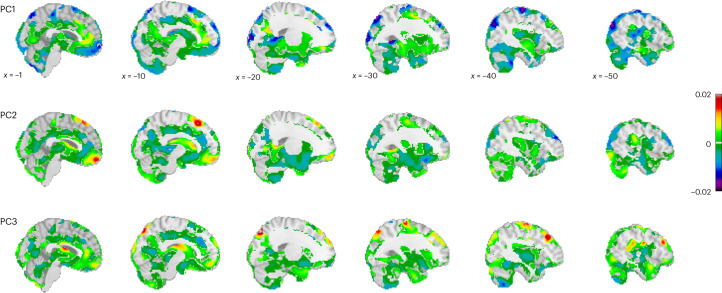
Fig. 3. Predictions of how brain morphometry (Jacobian determinants of deformation fields) changes as a function of adversity.
Spatial representation of the voxel-wise normative models for each of the PCs based on four sampling points spanning the range of the PC loadings. The panels show the β values (slopes) depicting the change, with warm colors indicating a volume expansion and cold colors indicating a volume contraction with increasing adversity. The adversity maps are shown relative to the baseline model.

