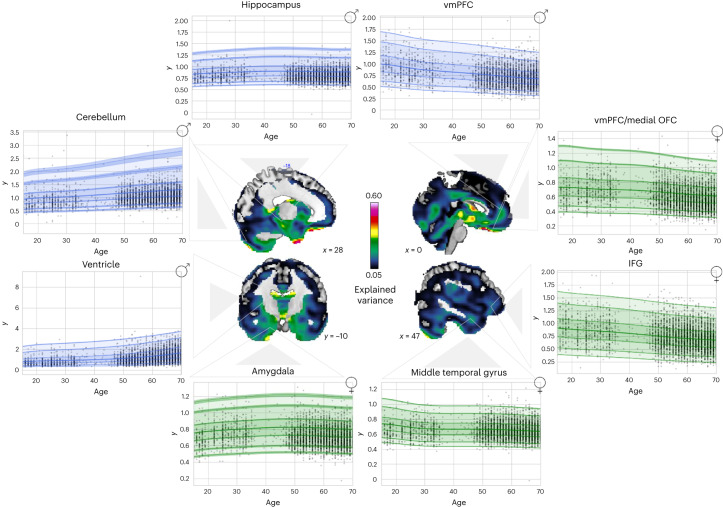
Fig. 4. Age-related JD development.
The data were split into training and test sets, and normative models were fit to predict JD development based on age, sex and site by using a warped Bayesian linear regression model. Explained variance in the full test set and visualizations for all regional age-related trajectories (green = females and blue = males; centiles of variation correspond to 1%, 5%, 25%, 50%, 75%, 95% and 99%) are depicted. For each region, the trajectory for only one sex is shown, but trajectories were similar for both sexes.

