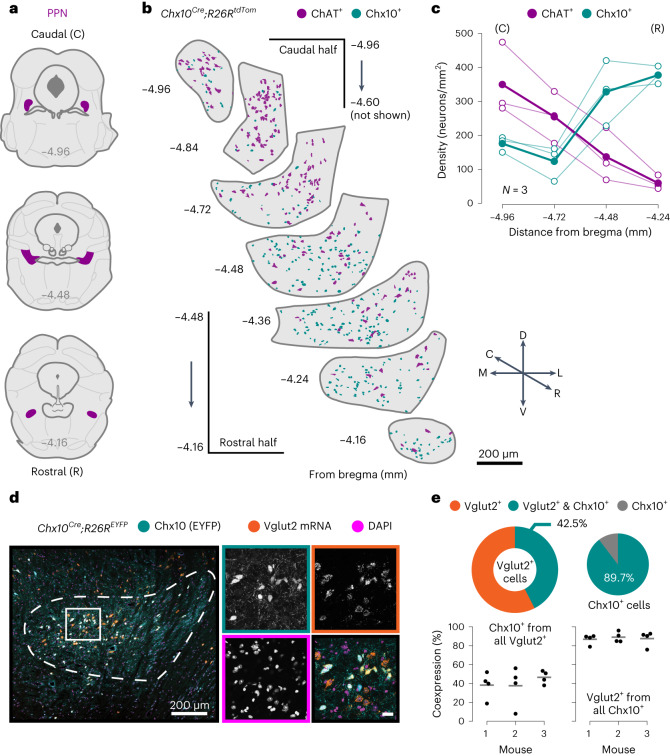
Fig. 1. Chx10-derived neurons define a subpopulation of glutamatergic PPN neurons with a rostral bias.
a, Coronal plane schematics highlighting the PPN (magenta) at different levels of its rostrocaudal axis. From bregma: caudal edge at −4.96 mm (top), rostral edge at −4.16 mm (bottom). b, Spatial distribution of Chx10+ (cyan, Chx10Cre; R26RtdTomato reporter mouse) and ChAT+ (magenta, antibody) neurons along the rostrocaudal axis of the PPN. C, caudal; R, rostral; D, dorsal; V, ventral; M, medial; L, lateral. c, Quantification of Chx10+ (cyan) and ChAT+ (magenta) neuron densities at four coronal levels of the PPN: −4.96 and −4.72 mm from the caudal half, −4.48 and −4.24 mm from the rostral half. For each cell type, hollow circles are individual mice and filled circles the group average (N = 3 mice, 1 hemisection/level/mouse). d, Left, confocal photomicrograph of the rostral PPN from a Chx10Cre; R26REYFP reporter mouse that labels all Chx10+ neurons (Chx10, cyan), in situ hybridization for Vglut2 mRNA (Vglut2 mRNA, orange) and nuclear staining (DAPI, pink). The dashed line delineates the PPN. The solid square delineates the magnified area. Right, single-channel images (grayscale) of the magnified area framed following the same color code, and the composite image (colored) at the bottom right. Scale bar, 20 µm. e, Percentage of neurons coexpressing Chx10 and Vglut2 within the PPN (from all Vglut2+, left; from all Chx10+, right). Most Chx10+ neurons also express Vglut2 mRNA. Pie charts depict group means (Vglut2+only, orange; Vglut2+ and Chx10+, cyan; Chx10+ only, gray). Strip plots show single hemisections and the mouse average (gray line; N = 3 mice, 4 hemisections/mouse).

