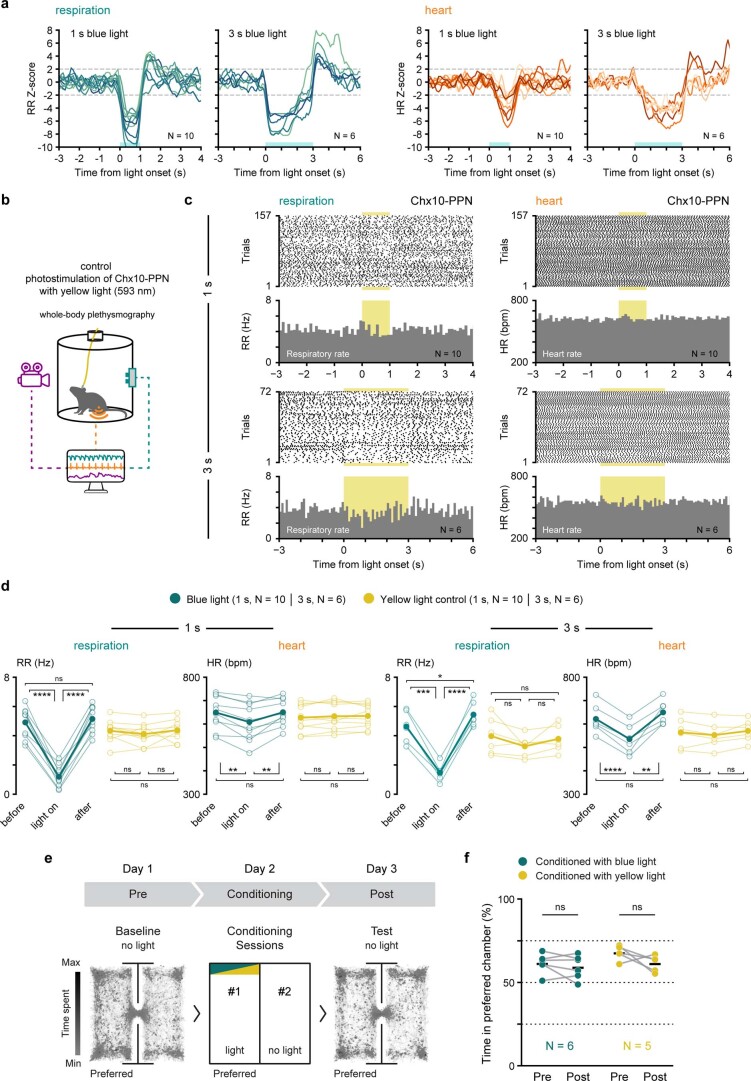
Extended Data Fig. 6. Consistency of respiratory and heart rate changes, control for the wavelength specificity of light stimulation, and conditioned place aversion test upon Chx10-PPN neuron stimulation.
a, Z-score for respiratory rate (RR; left, blue lines) and heart rate (HR; right, orange lines) upon Chx10-PPN neuron activation with either 1 or 3 s of blue light (baseline = 5 s before light onset for each mouse). Each line represents a mouse (N = 10 mice for 1 s, N = 6 mice for 3 s). b, Experimental strategy for simultaneous recording of respiratory, cardiac, and motor activity in unrestrained mice combined with optogenetics for control stimulation of Chx10-PPN neurons with yellow light (593 nm). c, Raster and peri-stimulus time histograms of the respiratory rate (RR, left) and the heart rate (HR, right) around yellow light delivery as a wavelength specificity control in mice expressing ChR2 in Chx10-PPN neurons (top, 1 s stimulation, N = 10 mice, 157 trials; bottom, 3 s stimulation, N = 6 mice, n = 72 trials). Yellow shades delimit yellow-light stimulus duration. d, Average respiratory rate (RR) and heart rate (HR) during each of the time epochs surrounding blue or yellow light stimulation (5 s before, 1 or 3 s light on, 5 s after). As opposed to blue light, yellow light does not evoke any significant changes in respiratory or heart rates (statistical comparisons correspond to adjusted P values from Tukey’s multiple comparisons test, see Supplementary Table 1 for details). For each rate, stimulus duration, and wavelength: hollow circles are individual mice and filled circles the group average, all connected across epochs. The same mice were first tested with blue light and then with yellow light (N = 10 for 1 s stimulus duration; N = 6 for 3 s). e, Timeline of the conditioned place aversion (CPA) paradigm with baseline (‘Pre’) and test (‘Post’) heatmaps representing the time spent across the entire arena for all mice conditioned with blue light (10 ms pulse width, 1 s train duration, 40 Hz; 1 s ON / 9 s OFF in a 30 minute session). f, Percentage of time that mice spent in their preferred chamber before (‘Pre’) and after (‘Post’) conditioning with blue light (left, N = 6 mice) or yellow light (right, N = 5 mice). Neither blue nor yellow light caused a change in place preference. Two tailed paired t-test, ‘Post’ vs. ‘Pre’: blue light, mean difference = −2.22 ± 5.87 % (s.d.), CI = −8.38 to 3.93, not significant (ns); yellow light, mean difference = −6.44 ± 8.4 % (s.d.), CI = −16.86 to 3.98, ns.

