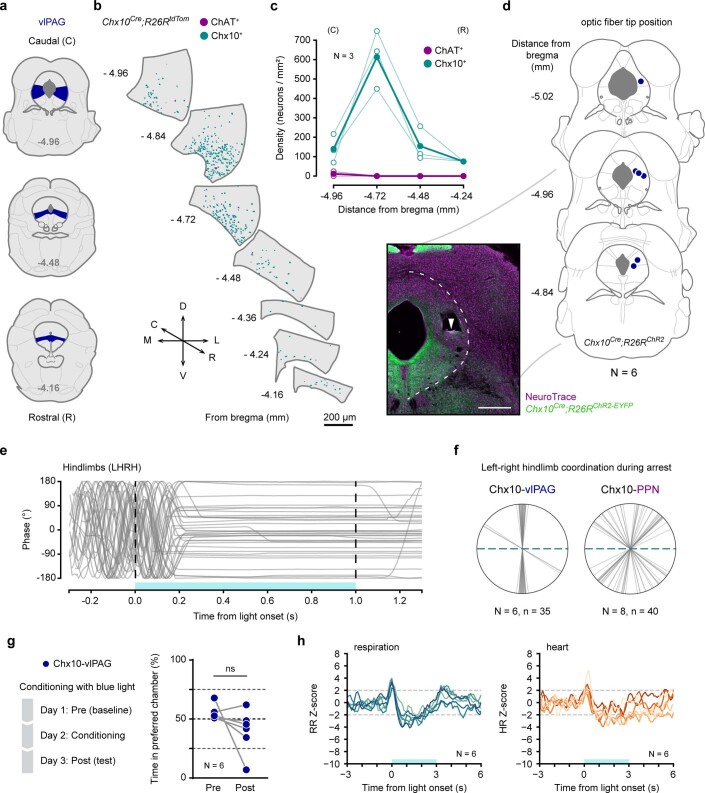
Extended Data Fig. 8. Distribution of Chx10+ neurons within the vlPAG, optic fiber positions, limb coordination, conditioned place aversion test, and heart and respiratory changes upon Chx10-vlPAG neuron activation.
a, Coronal plane schematics highlighting the vlPAG (blue) at different levels of its rostro-caudal axis. b, Spatial distribution of Chx10+ (cyan, Chx10Cre; R26RtdTomato reporter mouse) and ChAT+ (magenta, antibody) neurons along the rostro-caudal axis of the vlPAG. Only the coronal levels shared with the PPN are shown to facilitate comparison (see Fig. 1) although the vlPAG extends further caudally. C, caudal; R, rostral; D, dorsal; V, ventral; M, medial; L, lateral. c, Quantification of Chx10+ (cyan) and ChAT+ (magenta) neuron densities at four coronal levels of the vlPAG: −4.96 and −4.72 mm from the caudal half, −4.48 and −4.24 mm from the rostral half. For each cell type: hollow circles are individual mice and filled circles the group average (N = 3 mice, 1 hemi-section/level/mouse). d, Reconstruction of the optic fiber tip position in all Chx10Cre; R26RChR2 mice used for Chx10-vlPAG neuron stimulation experiments (N = 6) and example fluorescence photomicrograph of optic fiber placement. The white arrowhead points to the tip of the optic fiber. Scale bar 500 µm. e, Phase values for left-right hindlimb (LHRH) coordination during locomotion in the linear corridor temporarily interrupted by optogenetic Chx10-vlPAG neuron stimulation (N = 6, n = 35 trials total, 3–8 trials/mouse). f, Left-right hindlimb coordination during arrest for Chx10-vlPAG (left) and Chx10-PPN (right) represented by the line that unites the left and right hind-paws corrected for body axis. Each gray line corresponds to a trial in the linear corridor. Dashed blue lines correspond to the body axis. g, Conditioned place aversion (CPA) timeline (left) and quantification (right) of the percentage of time that mice spent in their preferred chamber before (‘Pre’) and after (‘Post’) conditioning with blue light (10 ms pulse width, 1 s train duration, 40 Hz; 1 s ON / 9 s OFF in a 30-minute session) in (N = 6 mice). Two tailed Wilcoxon matched-pairs signed rank test, ‘Post’ vs. ‘Pre’: not significant (ns). h, Z-score for respiratory rate (RR; left, blue lines) and heart rate (HR; right, orange lines) changes evoked upon Chx10-vlPAG neuron activation with 3 s of blue light. Each line represents a mouse (N = 6 mice for 3 s). Blue shades delimit light stimulus duration.

