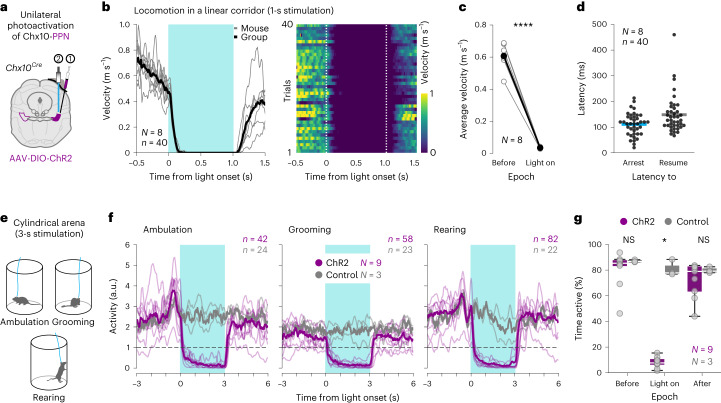
Fig. 2. Activation of Chx10-PPN neurons causes global motor arrest.
a, Experimental strategy to optogenetically target Chx10-PPN neurons in Chx10Cre mice. b, Effect of Chx10-PPN neuron activation on velocity during locomotion in a linear corridor. Left, group average velocity (black line; 40 trials) and mouse average velocities (gray lines; N = 8 mice, 5 trials/mouse). Right, velocity heat map for individual trials. Dashed vertical lines delimit light onset and offset. c, Average locomotor velocities while crossing the linear corridor before light onset (before) and during blue-light stimulation (light on; two-tailed paired t-test; light on versus before, mean speed difference = −0.57 ± 0.07 m s−1 (s.d.), CI = −0.63 to −0.51, P < 0.0001). Gray hollow circles are individual mice (mouse average), and black filled circles indicate the group average (N = 8 mice, 5 trials/mouse). d, Latencies to arrest locomotion from light onset (left, blue), and latencies to resume locomotion from light offset (right, gray). Dots are individual trials, and lines represent group means. e, Setup to assess the effect of Chx10-PPN neuron activation during slow ambulation, grooming and rearing. f, Arrest of all assessed behaviors during light stimulation in mice expressing ChR2 in Chx10-PPN neurons, while EYFP-expressing control mice are unaffected. For each treatment group (ChR2, magenta, N = 9 mice; control (EYFP), gray, N = 3 mice), thick lines are the group average activity and thin lines indicate the mouse average activity. Horizontal dashed lines define the inactivity threshold. Blue shades (b and f) delimit light stimulus duration. g, Percentage of time that mice spent being active within each of the 3-s epochs around stimulation (before, light on, after) in the cylinder test, all three behaviors combined. Mice in the ChR2-expressing group (magenta, N = 9) are inactive during stimulation, while mice in the EYFP-expressing control group (gray, N = 3) remain active (Mann–Whitney test with Holm–Sidak’s correction for multiple comparisons, ChR2 versus control, adjusted P values: light on, P = 0.027026; before and after NS). In box-and-whisker plots, white lines indicate medians, box edges the IQR, and whiskers extend to the minimum (Q1 – 1.5 × IQR) and maximum (Q3 + 1.5 × IQR). Circles represent individual mice. a.u., arbitrary units.

