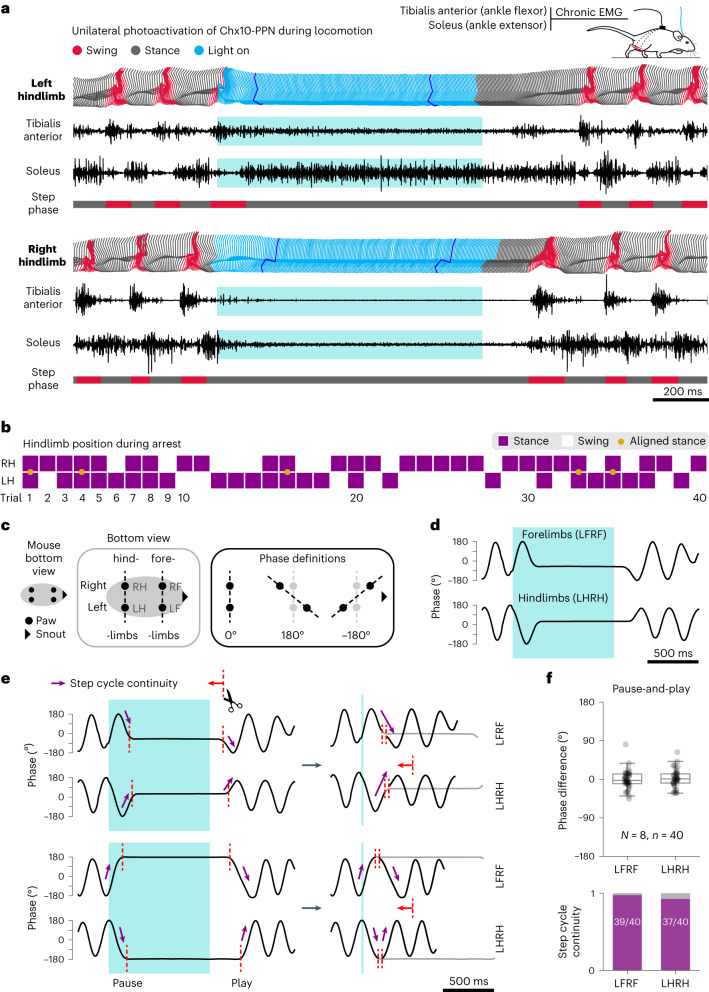
Fig. 3. The Chx10-PPN-evoked motor arrest has a pause-and-play pattern without a distinct kinematic signature.
a, Hindlimb dynamics of a Chx10Cre mouse expressing ChR2 in the PPN during a locomotor bout in the linear corridor temporarily interrupted by activation of Chx10-PPN neurons. Left and right hindlimb activity represented with three methods: top, stick diagrams to track joint positions over time; middle, EMG recordings showing the activity of ankle flexor (tibialis anterior) and ankle extensor (soleus) muscles; bottom, step-phase classification into stance (gray) and swing (red) phases. Stick diagrams follow the same color code, except during the light-on period (light blue). Dark-blue sticks highlight how joints remain in the same position throughout the stimulation once an arrest position has been reached. b, Hindlimb (RH, right; LH, left) position during arrest. Solid magenta squares indicate stance phase, while empty squares indicate swing phase. Yellow dots indicate that the animal had both legs on the ground aligned perpendicular to the body axis (n = 40 trials, N = 8 mice). c, Explanatory diagrams of the limb coordination tracking based on paw positions (bottom view). Phase values are defined by the distance on the x axis between left and right forelimbs or hindlimbs. d, Representative example of phase values for LFRF and LHRH during locomotion in a Chx10-PPN stimulation trial. e, Representative stimulation trials illustrating step cycle continuity after light offset, both when the arrest happens midway (top example, rising or falling phase), or at maximum left–right displacement (bottom example, peak or trough). f, Quantification of the pause-and-play pattern. Top, phase difference between pause-and-play time points for forelimbs (left) and hindlimbs (right). Bottom, step cycle continuity as illustrated by purple arrows in e, quantified as a binary outcome for all trials. In box-and-whisker plots, central lines indicate medians, box edges the IQR, and whiskers extend to the minimum (Q1 – 1.5 × IQR) and maximum (Q3 + 1.5 × IQR). Circles represent individual trials (n = 40 trials, N = 8 mice, 5 trials/mouse). Blue shades (a, c and d) delimit light stimulus duration.

