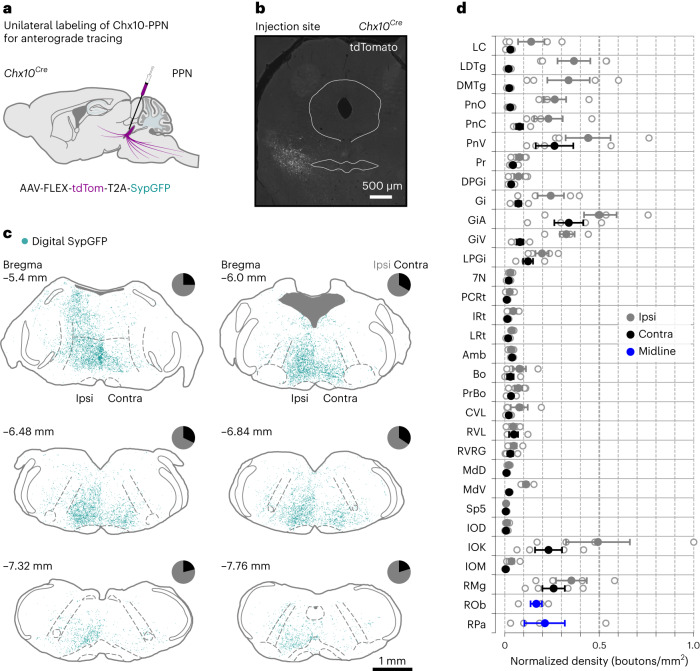
Fig. 6. Brainstem projection targets from Chx10-PPN neurons.
a, Experimental strategy to unilaterally label Chx10-PPN neurons with an anterograde tracer (AAV-FLEX-tdTom-T2A-SypGFP) to reveal their projection pattern. b, Example fluorescence photomicrograph (coronal plane) of the rostral PPN at the injection site with tdTomato-expressing Chx10-PPN neurons in white. c, Reconstruction of putative synaptic bouton positions (digital SypGFP, cyan) from Chx10-PPN neuron projections at six different brainstem levels. The boutons are mostly located in the medial zone of the pontine and medullary reticular formations. Pie charts at each coronal level depict the percentage of boutons ipsilateral (ipsi, gray) or contralateral (contra, black) to the injection site, with the majority of them being ipsilateral at all brainstem levels. d, Normalized average bouton density in selected structures located within the coronal levels reconstructed in c. For each structure, the ipsilateral (gray) and contralateral (black) sides are quantified separately, unless they are midline structures (blue). Error bars represent the s.e.m. and hollow circles denote individual mice (N = 4 mice). For an extended overview and full names of all abbreviations, see Extended Data Fig. 10, which also includes projection areas in the midbrain and diencephalon.

