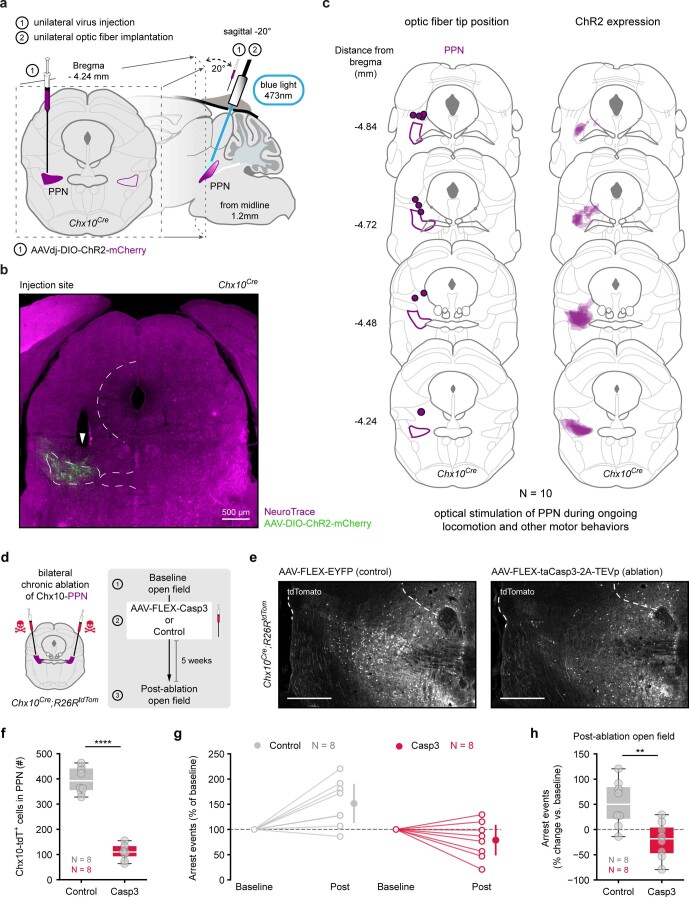
Extended Data Fig. 2. Experimental approach to target Chx10-PPN neurons during optogenetic activation and ablation experiments.
a, Extended overview of the experimental strategy to optogenetically target Chx10+ neurons in the PPN using a Cre-dependent viral approach in Chx10Cre mice. b, Example photomicrograph (coronal plane) of the rostral PPN at the injection site with the ChR2-mCherry-expressing Chx10-PPN neurons in green and a fluorescent Nissl stain (NeuroTrace) in violet. White arrowhead points to the tip of the optic fiber. c-d, Reconstruction of the optic fiber tip position (c) and ChR2 expression (d) for all mice (N = 10) used in the optogenetic experiments performed to assess the effect of Chx10-PPN activation during ongoing locomotion (linear corridor; N = 8) and during other motor behaviors (ambulation, grooming, rearing; cylinder test; N = 9). d, Experimental strategy to assess the effect of Chx10-PPN neuron ablation over naturally occurring arrest events using a Cre-dependent Caspase3-based viral approach in Chx10Cre; R26RtdTomato mice. e, Example fluorescence photomicrographs of the PPN from Chx10Cre; R26RtdTomato reporter mice with Chx10+ neurons expressing tdTomato (white), acquired after the post-ablation open field time point. Left, PPN of an EYFP-injected control mouse; right, PPN of a Casp3-injected mouse. For anatomical reference, in both images the dashed lines delimit the lateral border of the parabigeminal nucleus (left) and the ventral border of the periaqueductal gray (right). Scale bars, 500 µm. f, Number of Chx10-tdTomato+ cells in the PPN of Control (left, gray) and Casp3 (right, red) mice (N = 8 mice per group; bilateral counts, one section/mouse) (two-tailed unpaired t-test, Control vs. Casp3: difference between means = 286.72 cells, CI = 239.3 to 117.66 cells, P < 0.0001). g, Arrest events in the open field during baseline and post-injection open field sessions in control mice (left, gray; N = 8) and Casp3-injected mice (right, red; N = 8), displayed as the % of baseline for each mouse. Hollow circles are individual mice, solid circles and error line are the mean and CI. h, Arrest events in the post-injection open field session displayed as the % change from baseline for each mouse (two-tailed unpaired t-test, Control vs. Casp3: difference between means = 72.72 %, CI = 27.84 to 117.66 %, P = 0.0039). In box-and-whisker plots, white lines indicate medians, box edges the interquartile range (IQR), and whiskers extend to the minimum and maximum. Circles represent individual mice.

