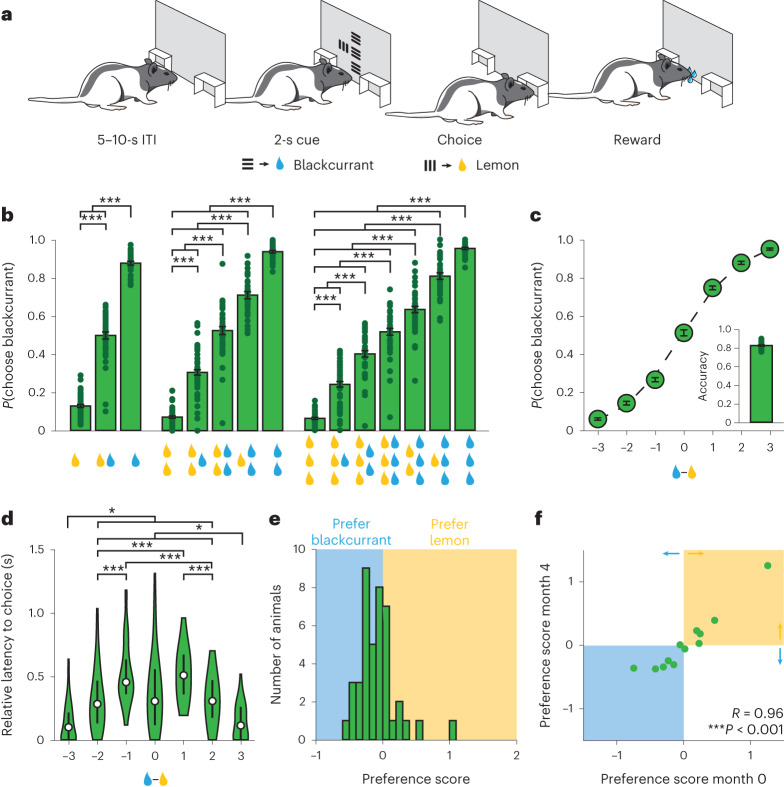
Fig. 1. Rats integrate information about reward quantity and reward identity to make economic decisions.
a, Schematic of economic decision-making task for rats. b, Probability of choosing the blackcurrant-predictive cue for all cue combinations (n = 42 rats, one-way repeated-measures analysis of variance (ANOVA)). c, Probability of choosing the blackcurrant-predictive cue as a function of difference in size of the reward available. Rats were more likely to choose the larger available reward (n = 42 rats, one-way repeated-measures ANOVA). Inset, fraction of trials in which the animal chose the larger available reward (n = 42 rats, 0.82 ± 0.01). d, Latency to choice nosepoke response as a function of the difference in the size of the reward available. Rats were faster when the difference in reward volume was high (easy trials) (n = 42 rats, one-way repeated-measures ANOVA). The center dot represents the median, the bars represent the first and third quartiles. e, Histogram of preference scores: the difference in available reward at which the animal was equally likely to choose the blackcurrant-predictive or lemon-predictive cue (negative values, blue shading: rats preferring blackcurrant; positive values, yellow shading: rats preferring lemon; n = 42 rats). f, Correlation of preference scores computed on sessions performed 4 months apart. Preference scores were highly correlated, indicating that the juice preferences of individual animals were stable across time (n = 12 rats, Pearson correlation). *P < 0.05, ***P < 0.001. Unless otherwise noted, data are presented as the mean ± s.e.m. Full statistical details are shown in Supplementary Table 1.

