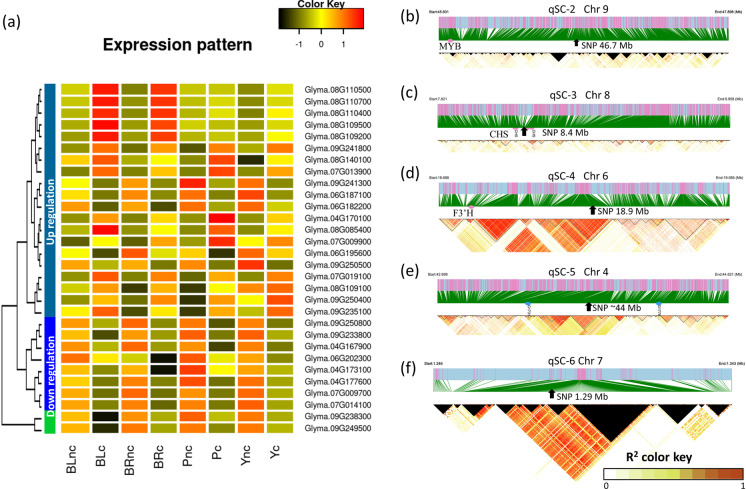
Fig. 5.
Key gene expressional regulation in mapped loci for seed color accumulation. a The heatmap showing the expression level of key differentially expressed genes near associated SNPs during pigment accumulation in the seed coat. The average gene expression levels are the Z-score of average values of fragments per kilobase of transcript per million mapped reads from three biological experiments. The gene names were listed on the right of each row. The X-axis shows the sample names with different seed coat colors, where BL, BR, P, and Y represent black, brown, purple, and yellow, respectively. The tree on the left side of the heatmap shows the grouped expressional patterns of genes across samples. The suffix nc and c in the sample name represent the control before and after color formation, respectively. b, c, d, e, f The linkage disequilibrium (LD) blocks of the associated locus on regions qSC-2, -3, -4, -5, and -6 on chromosomes, respectively. The threshold to estimate LD blocks was set to R-squared 0.8. The arrow pointed position indicates the most significant SNP in the genome-wide association study. The red dots denote the position of a known gene. The blue dots represent the position of newly mapped two genes on chromosome 4. The significant single nucleotide polymorphism (SNP) position on chromosome 4 is the average value of two adjacent SNPs. The black triangle areas represent the R-squared values that were not available

