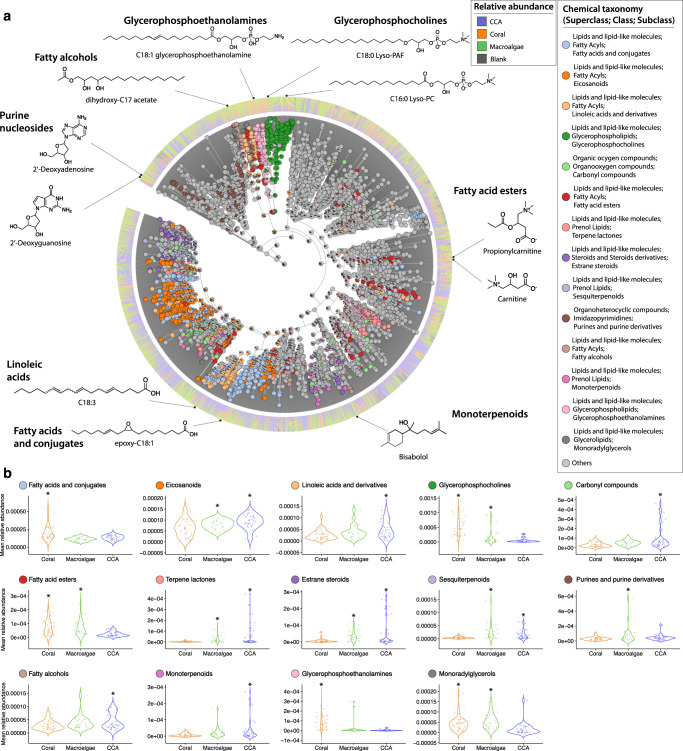
Fig. 5. Chemical classification of diverse ion features and subclasses that are differentially associated with each coral reef primary producer.
a A chemical hierarchy of the predicted molecular fingerprints from the CCA, coral and macroalgae samples. The tree is pruned to keep only fingerprints classified to a subclass level in the ChemOnt ontology using ClassyFire123 (total of 3,205 branches). Tree tips of the dendrogram show the annotation of each chemical feature. The internal nodes with pie charts depict the distribution of subclasses with differential abundance among primary producers (ANOVA, p < 0.04), and the bar plots at the outer ring indicate the relative abundance of a molecular fingerprint in each primary producer type. The structures shown were retrieved from spectral library matches of the feature-based molecular networking workflow (level 2 or 3 annotations according to the 2007 metabolomics standards initiative47), and the compounds present in the samples could be their isomers. b Violin plots display the distribution of each subclass in coral (n = 42), macroalgal (n = 24), and CCA (n = 37) tissue samples.

