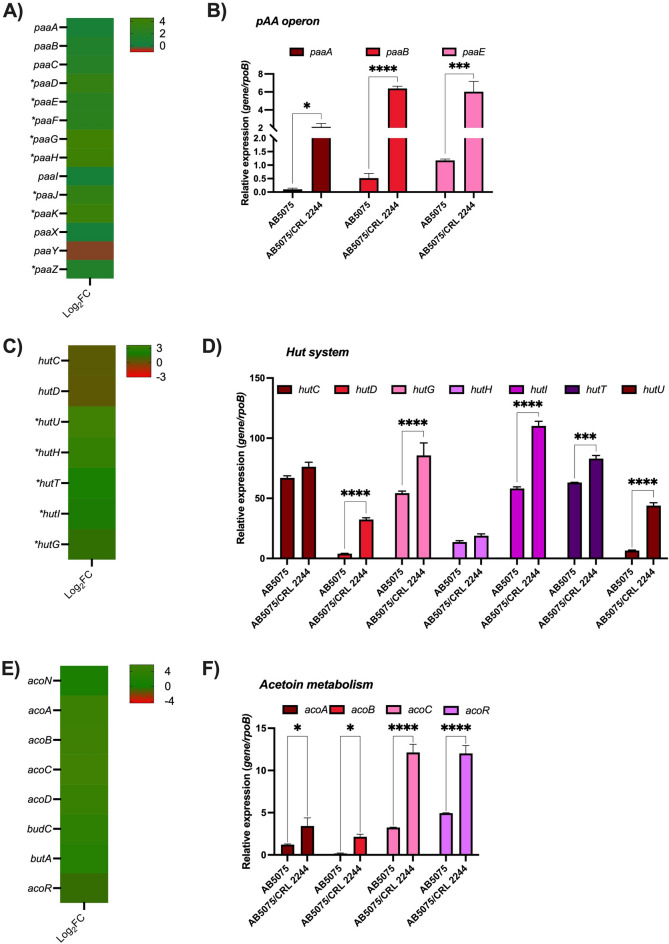
Figure 4.
AB5075 transcriptional results of representative metabolic pathways affected by Lcb. rhamnosus CRL 2244. (A) Heatmap outlying the differential genes expression of genes involved in the phenylacetic acid catabolic pathway. Asterisks represent a P value of < 0.05. (B) qRT-PCR of paaA, paaB, and paaE of AB5075 grew on BHI or in co-culture with Lcb. rhamnosus CRL 2244. (C) Heatmap outlying the differential genes expression of Hut system codifying genes involved in histidine metabolism. Asterisks represent a P value of < 0.05. (D) qRT-PCR of hutC, hutD, hutG, hutH, hutI, hutT, and hutU of AB5057 grew on BHI or in co-culture with Lcb. rhamnosus CRL 2244. (E) Heatmap representing the differential genes expression genes involved in acetoin metabolism. Asterisks represent a P value of < 0.05. (F) qRT-PCR of acoA, acoB, acoC, and acoR of AB5057 grew on BHI or in co-culture with Lcb. rhamnosus CRL 2244. For qRT-PCR assays three independent samples were used. Statistical significance (P < 0.05) was determined by two-way ANOVA followed by Tukey’s multiple-comparison test, one asterisks: P < 0.05; two asterisks: P < 0.01, and three asterisks: P < 0.001.

