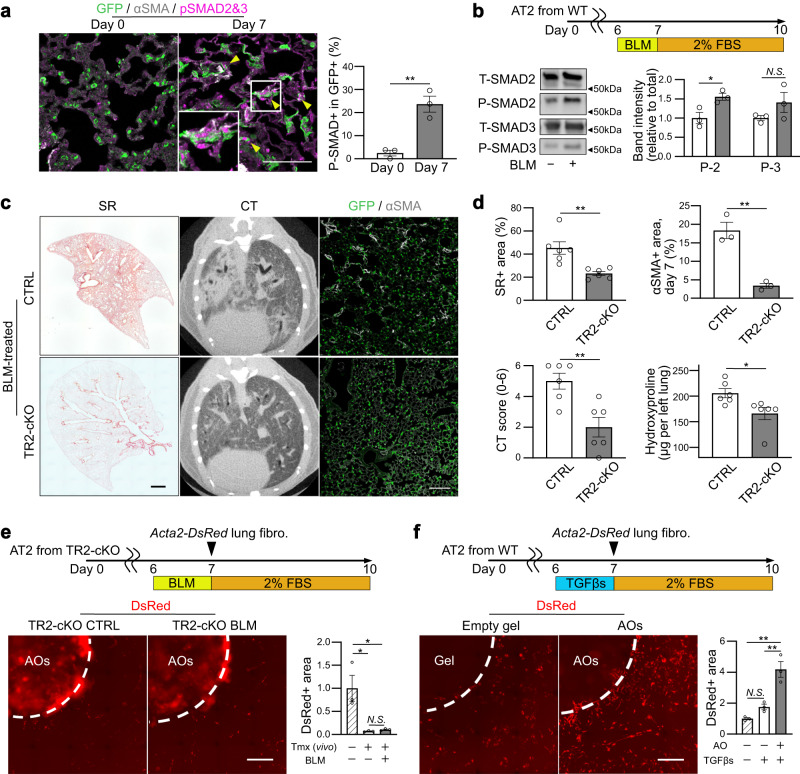
Fig. 7. Identification of cell-autonomous TGF-β-positive feedback loop in AT2-lineage cells.
a Representative images of immunostaining (scale bar: 100 μm) and quantification. Lung sections from BLM-treated SftpcCreERT2; Rosa26mTmG mice were stained with anti-GFP, anti-phosphorylated SMAD (p-SMAD) 2&3, and anti-αSMA antibodies. Triangles indicate p-SMAD2&3+GFP+ AT2-lineage cells. Data represent the mean ± SEM of results obtained from three independent mice. **P < 0.01 compared to day 0 (unpaired, two-tailed Student’s t test). b Experimental set-up, representative images of protein expression of AOs via western blotting for total/phosphorylated SMAD2/3, and quantification. The samples were derived from the same experiment and gels/blots were processed in parallel. Data represent the mean ± SEM of results obtained from three independent mice. *P < 0.05 (unpaired, two-tailed Student’s t test). The lanes were run on the same gel. c Representative images of the lung sections for SR staining (scale bar: 1 mm), lung mCT, and lung sections stained with anti-GFP and anti-αSMA antibodies (scale bar: 100 μm). The SftpcCreERT2; Rosa26mTmG mice (CTRL) and SftpcCreERT2; Tgfbr2flox/flox; Rosa26mTmG mice (TR2-cKO) were treated with BLM in vivo. d Quantification of SR staining (day 21, n = 6), mCT (day 21, n = 6), αSMA+ area (day 7, n = 3), and hydroxyproline in the left lungs (day 21, n = 6). Data represent the mean ± SEM of results obtained from three or six independent mice. *P < 0.05, **P < 0.01 (unpaired, two-tailed Student’s t-test). e Representative images of co-cultured (myo)fibroblasts using TR2-cKO AO treated with BLM (100 μM, 24 h) (scale bar: 1 mm) and quantification of the relative DsRed+ area around the AO-containing gel. Data represent the mean ± SEM of results obtained from three independent mice. *P < 0.05 (one-way analysis of variance with Bonferroni correction). f Representative images of co-cultured (myo)fibroblasts using normal AO treated with mixed TGF-β1/β2/β3 (5 pg mL−1 each, 24 h) (scale bar: 1 mm) and quantification of the relative DsRed+ area around the empty or AO-containing gel. Data represent the mean ± SEM of results obtained from three independent mice. **P < 0.01 (one-way analysis of variance with Bonferroni correction).

