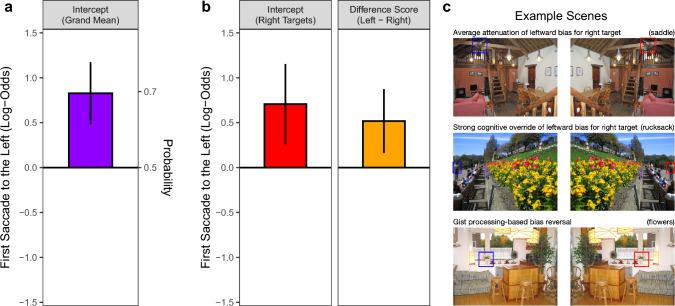
Fig. 3.
Probability of the first saccade going to the left. a The overall probability was evaluated with a binomial varying-intercept GLMM with no predictors. The height of the violet bar represents the fixed-effect estimate for the intercept on the log-odds scale. The right y-axis indicates probability values; the error bar represents the 95% confidence interval (CI = ± 1.96 × SE). b The effect of target location on the left-direction of the first saccade was assessed with a dummy-coded GLMM including a by-item random slope for ‘target location’. The red bar represents the fixed-effect estimate for the right targets, whereas the orange bar depicts the difference between left and right targets. c The bar charts in b are complemented by three example scene pairs for which the results were either similar or dissimilar to the mean response. See text for details

