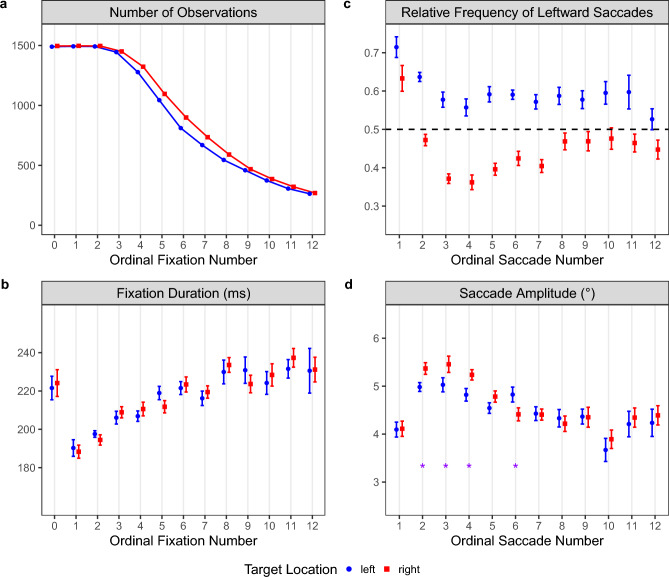
Fig. 5.
Adjustment of eye-movement parameters over time depending on whether the target object was located on the left side (blue dots) or right side (red squares) of the scene. a Total number of observations for the initial central fixation (#0) and the following 12 fixations. b Mean fixation duration for each ordinal fixation. c Mean relative frequency of leftward saccades, with values above the dashed line indicating that more saccades went left than right. d Mean saccade amplitude for each of the first 12 saccades, with the asterisks indicating a significant difference between the two target-location conditions. In panels b, c, and d, the means were computed across participants’ means, with the error bars representing within-subjects standard errors (Cousineau 2005; Morey 2008). Note that the y-axes in these panels do not start at zero

