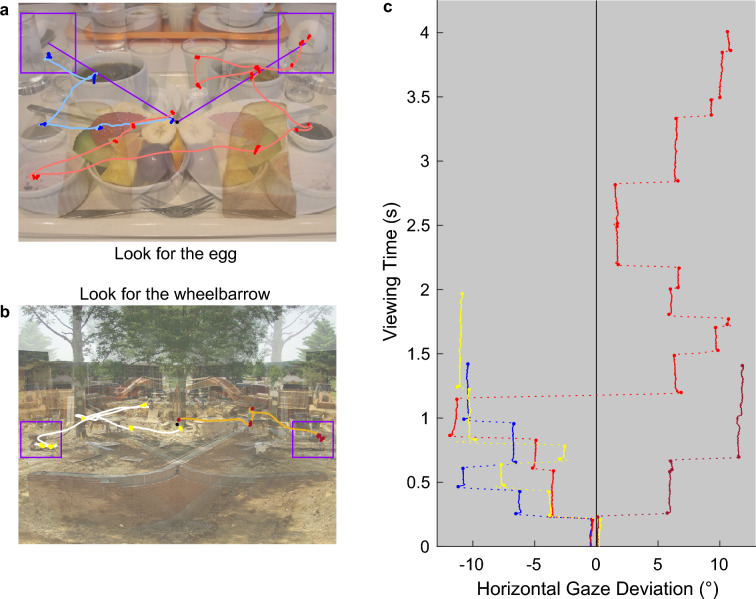
Fig. 8.
Examples visualizing how individual two-dimensional gaze traces were converted to changes of horizontal gaze deviation over time. a Raw gaze data obtained for the L-scene and the corresponding mirrored R-scene displayed in the top row in Fig. 1. The data are plotted over a blended version of the two images. The blue gaze trace is from an observer searching for the target object (the egg) in the upper left of the image. Correspondingly, the red gaze trace leads to the mirrored target object in the upper right. Saccades are plotted in lighter colors than fixations. The violet rectangles denote the interest areas comprising the target objects. In addition, the straight violet lines connect the center of the image (black dot) with the center of the respective interest area, thereby representing the most direct path to the target object. b Gaze traces obtained for the R-scene and the mirrored L-scene that are shown in the bottom row of Fig. 1. The gaze trace to the right-side target is presented in brown (fixations) and orange (saccades), and the one to the left-side target in yellow (fixations) and white (saccades). c The four gaze traces from the left panels displayed as horizontal gaze deviation from the vertical midline of the scene. The line colors are the colors in which the fixations appear in the left panels. The solid vertical segments are the fixations, and the dotted horizontal lines are the saccades. Additional dot markers highlight the beginnings and ends of saccades. Both fixations and saccades were included in the averaging process described in the text

