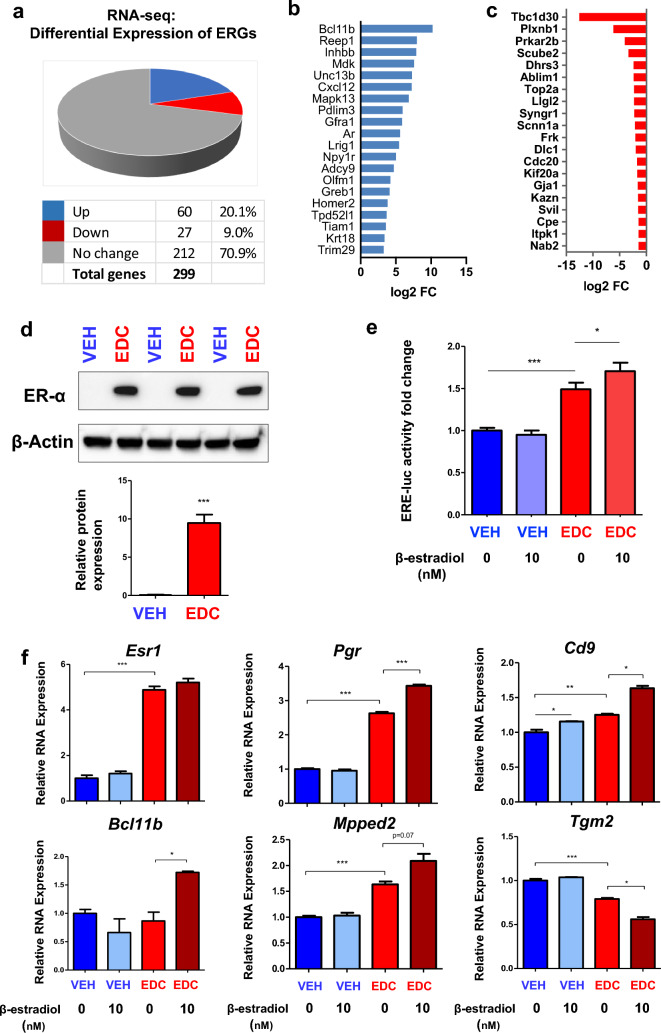
Fig. 3.
Transcriptional profiling reveals reprogramming of estrogen-responsive gene. a Pie chart showing the percentage of ERGs that exhibited changes in RNA expression in EDC-MMSCs compared to VEH-MMSCs, as measured by RNA-seq. b List of the top 20 up-ERGs, that showed differential expression as measured by RNA-seq in EDC- vs. VEH-MMSCs. c List of the top 20 down-ERGs, that showed differential expression as measured by RNA-seq in EDC- vs. VEH-MMSCs. d ER-a is upregulated in EDC-MMSCs compared to VEH-MMSCs. Lysates were prepared from EDC-MMSCs and VEH-MMSCs and subjected to Western blot analysis using antibody against ER-a. e Luciferase activities in the presence or absence of estrogen (10 nM) were compared between EDC-MMSCs and VEH-MMSCs. f Alteration of ERG expression in the presence or absence of estrogen in DES-MMSCs and VEH-MMSCs. Student’s t-test, *p < 0.05; **p < 0.01; ***p < 0.001

