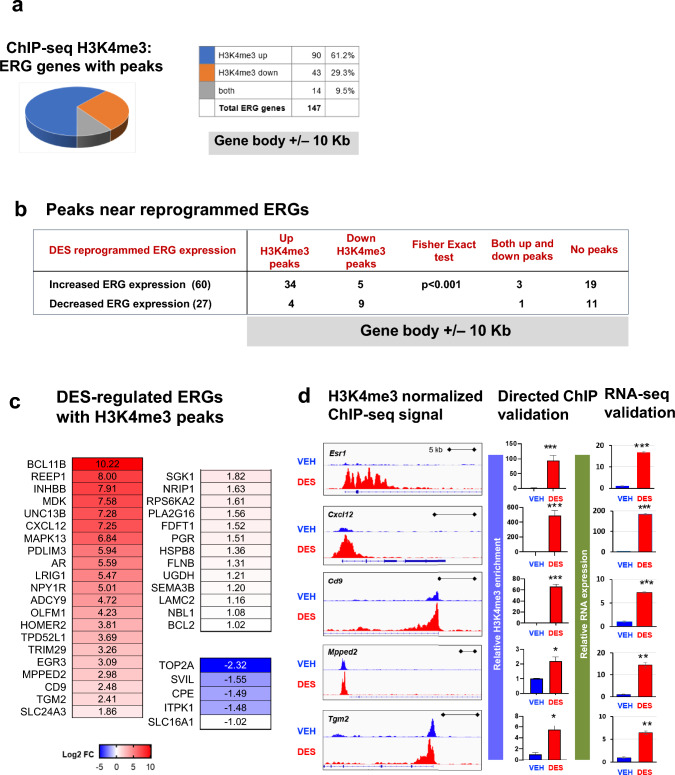
Fig. 5.
EDC exposure disrupted the epigenome in MMSCs. a Pie chart showing the number of ERGs with peaks. b Integration of H3K4me3 with RNA expression of ERGs by EDC exposure. c EDC-regulated ERGs with H3K4me3 peaks. d Histograms from Integrative Genomics Viewer showing H3K4me3 occupancy at Esr-1, Cxcl12, Cd9, Mpped2, and Tgm2 (left panel). For each gene, the upper and the lower browser images display an expanded view of a selected region of the H3K4me3 peak distributions in VEH-MMSCs (blue track) and EDC-MMSCs (red track). Middle panel: directed ChIP-sequencing validation of H3K4me3 target genes by ChIP-qPCR; right panel; RNA-sequencing validation by q-PCR. Student’s t-test, *p < 0.05; **p < 0.01; ***p < 0.001

