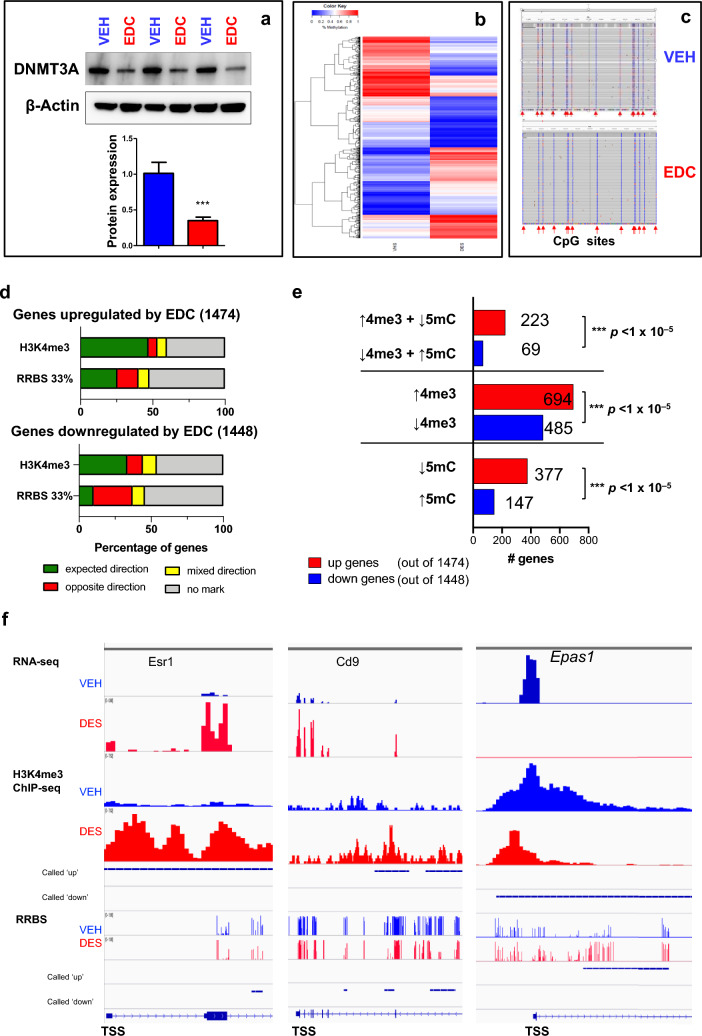
Fig. 7.
Developmental EDC exposure alters the methylome and reprograms ERGs via DNA promoter methylation. a Western blot analysis was performed to measure the protein levels of DNMT3A in VEH-MMSCs and EDC-MMSCs. b Heatmap of genes with DNA methylation in VEH- and EDC-MMSCs. c The methylation tracks of Esr1 determined by targeted bisulfite NGS, which covered 14 CpG sites located in its CpG island. d Percentage of EDC-regulated genes with status of H3K4me3 and DNA methylation. e Number of genes with status of H3K4me3 and DNA methylation. f Integrated genome viewer (IGV) plots and integration of multi-omic analysis. Peaks with H3K4me3 enrichment, DNA methylation, and RNA expression in EDC-MMSCs are indicated in red, while peaks with H3K4me3 enrichment, DNA methylation, and RNA expression in VEH-MMSCs are indicated in blue. Student’s t-test, ***p < 0.001

