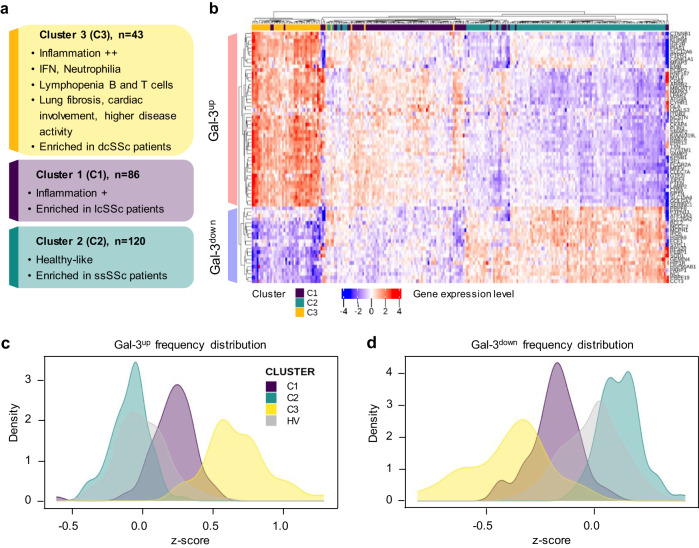
Fig. 1. Molecular characterization of SSc patient clusters and their Gal-3 fingerprint.
a Description of patient clusters C1, C2, and C3 characteristics based on their main molecular pathways and clinical features. b Gene expression heatmap of the top 69 Gal-3 interactants allowing to discriminate SSc patients clusters from each other (C3, yellow: n = 43; C1, purple: n = 86; C2, turquoise: n = 120). Gene expression intensities are displayed as colors ranging from blue for the lowest expression level to red for the highest expression level as shown in the key. Each individual subject is represented by one vertical line. Differentially expressed Gal-3 interactants are represented by individual horizontal lines and listed on the right. c, d Frequency distribution plots of Gal-3up (c) and Gal-3down (d) scores for each SSc patient cluster and healthy volunteers (HV). dcSSc, lcSSc, and ssSSc, diffuse cutaneous, limited cutaneous, and sine scleroderma systemic sclerosis, respectively.

