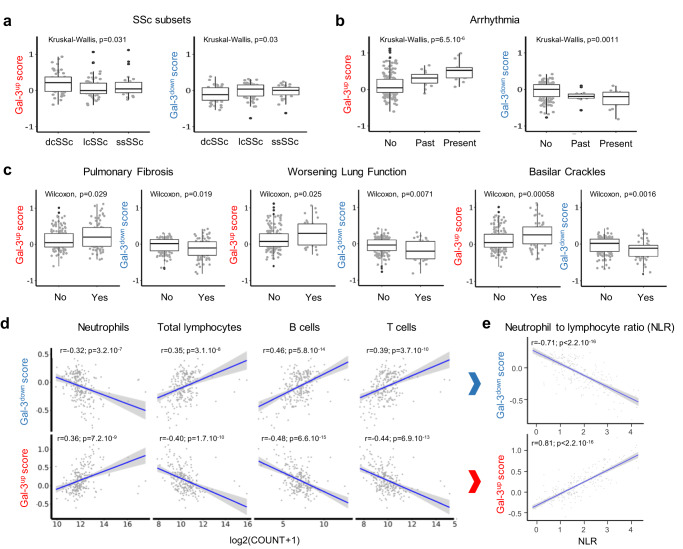
Fig. 2. Association between SSc patient subsets, impaired cardiac and lung functions, immune cell populations, and Gal-3 scores.
a Association between Gal-3up and Gal-3down scores and SSc patients subsets collected for 141 patients (dcSSc, diffuse cutaneous SSc: n = 49; lcSSc, limited cutaneous SSc: n = 64; ssSSc, sine scleroderma SSc: n = 28). b Association between Gal-3up and Gal-3down scores and cardiac arrythmia collected for 223 patients: no 194; past 15; present 14). c Association between Gal-3up and Gal-3down scores and lung dysfunction assessed by pulmonary fibrosis (data collected for 231 patients: no 145; yes 86), worsening lung function (data collected for 221 patients: no 185; yes 36), and basilar crackles (data collected for 248 patients: no 189; yes 59). Results in a–c are depicted as boxes and whiskers plots defined by minimal, maximal, and median values in each dataset. The upper whisker extends from the hinge to the largest value no further than 1.5 * IQR from the hinge (where IQR is the inter-quartile range or distance between the first and third quartiles). The lower whisker extends from the hinge to the smallest value at most 1.5 * IQR of the hinge. Data beyond the end of the whiskers are called outlying points and are plotted individually. Statistical analyses were performed using the Kruskal–Wallis test (a, b) or the two-sided Wilcoxon test (c). d Correlation between Gal-3up and Gal-3down scores and blood immune cell populations. Data were collected from n = 211 patients. e Correlation between Gal-3up and Gal-3down scores and neutrophil to lymphocyte ratio calculated from d. Two-sided Pearson’s correlation coefficient was used for statistical analyses performed on log-transformed data in d and e, using a linear regression model (blue line) and a 95% confidence interval represented by the gray area. All p-values are reported in each panel.

