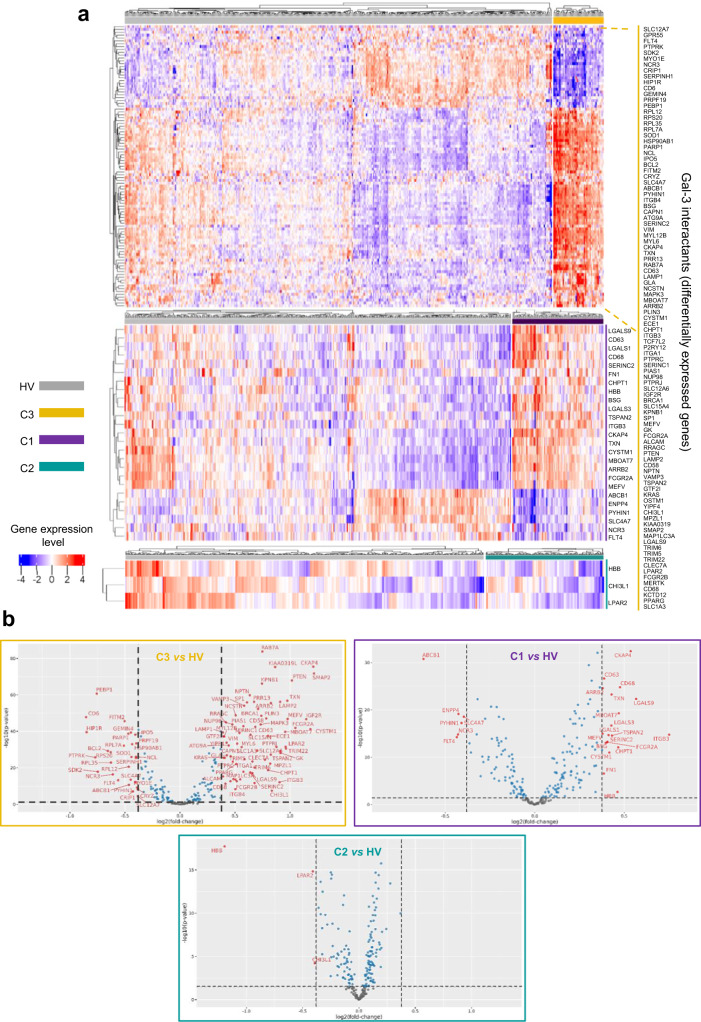
Fig. 3. Gene expression heatmap and volcano plots of Gal-3 interactants differentially expressed between each SSc patient cluster and healthy volunteers (HV).
a Heatmap, gene expression intensities are displayed as colors ranging from blue for the lowest expression level to red for the highest expression level as shown in the key. Healthy volunteers (HV) are represented by the gray bar, and patients of the C3 (n = 43), C1 (n = 86), and C2 (n = 120) clusters are represented by the yellow (top figure), purple (middle figure) and turquoise (bottom figure) bars, respectively. Each individual subject is represented by one vertical line. Differentially expressed Gal-3 interactants are represented by individual horizontal lines and listed on the right. b Volcano plot representations of Gal-3 interactants differentially expressed between C3 and HV (upper left panel), C1 and HV (upper right panel), and C2 and HV (bottom panel). The horizontal dotted line indicates the p-value cut-off (FDR 1.3). The vertical dotted lines indicate the fold-change cut-off values (minus 1.3 and plus 1.3). Gray dots represent the genes below the p-value and fold-change cut-off values; blue dots represent the genes fulfilling the p-value criterion but not the expected fold-change cut-off; red dots represent genes fulfilling all statistical requirements and correspond to genes identified as ‘differentially expressed’. The detailed list of Gal-3 interactants differentially expressed between each cluster and HV is presented in Supplementary Data 2.

