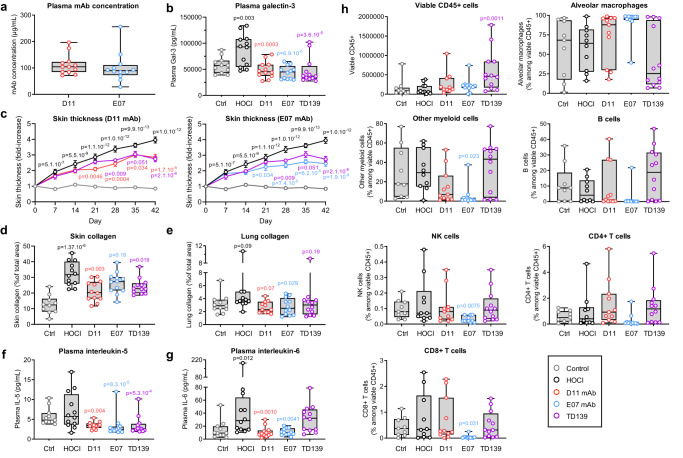
Fig. 5. Efficacy of anti-Gal-3 treatments in the mouse model of HOCl-induced SSc.
Control (Ctrl, light gray open circles) and HOCl (dark open circles) groups represent vehicle-receiving and pathology-induced mice, respectively. D11 (red open circles), E07 (blue open circles) and TD139 (purple open circles) groups represent anti-Gal-3 treatments administered in HOCl-induced mice as described in the Methods section. Data are representative of one experiment conducted with 11 biologically independent mice for the control group and n = 12 biologically independent mice for all other groups, except in specific cases due to experimental sample loss or unavailability, as detailed in the source data file. a Plasma Gal-3 exposure of mAbs at termination day. b Plasma Gal-3 levels measured at termination day. c Longitudinal measurements of skin thickness by external caliper. d, e Assessment of collagen deposition by Picrosirius red staining of skin and lung tissue. f, g Plasma levels of IL-5 and IL-6 measured by multiplex cytokine assay at termination day; h FACS immunophenotyping analysis of immune cells in the bronchoalveolar fluid at termination day. All results are depicted as boxes and whiskers plots defined by minimal, maximal, and median values in each dataset, except in c, for which means ± sem values are shown. Statistical analyses in e and h were performed on log-transformed data using a one-way ANOVA for comparison between the HOCl and control group, and with a one-way ANOVA for comparison between all tested items and their HOCl control group, using Dunnett’s adjustment. A similar analysis was performed in d, without log transformation. Statistical analyses in b, f, and g were performed on log-transformed data using a mixed ANCOVA model for comparison between the HOCl and control group, and using a mixed ANCOVA model for comparison between all tested items and their HOCl control group, using Dunnett’s adjustment. Statistical analyses in c were performed using a repeated measures ANOVA for comparison between the HOCl and control group, and with a one-way ANOVA for comparison between all tested items and their HOCl control group, using Dunnett’s adjustment. The baseline (day minus one) was added as covariable.

