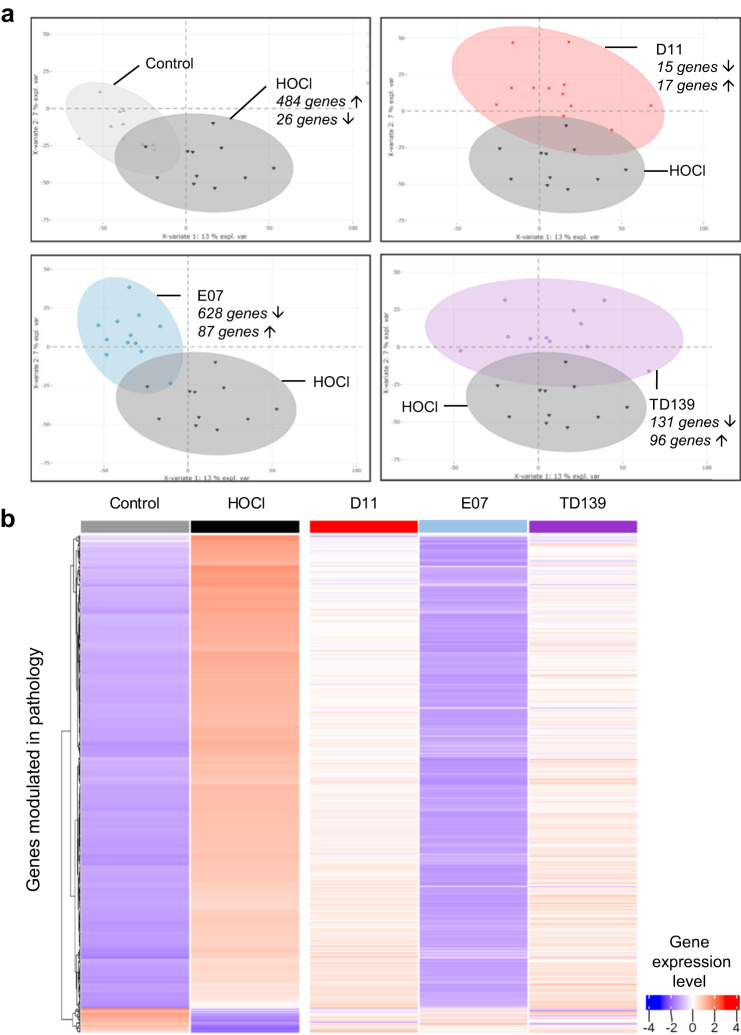
Fig. 6. Whole-blood cells RNAseq analysis of anti-Gal-3 treatments in the mouse model of HOCl-induced SSc.
a Partial least-squares-discriminant analysis (PLS-DA) of differential gene expression between HOCl-induced (dark gray) and untreated (control, light gray) group, or HOCl-induced groups treated with D11 (red), E07 (blue) or TD139 (purple), and HOCl untreated group. The number of upregulated (up arrow) or downregulated (down arrow) genes with false discovery rate (FDR) below 0.05 and absolute fold-change (FC) above 1.3 refers to each relevant comparative analysis. b Gene expression heatmap showing the 510 genes differentially expressed between the HOCl-induced and control groups, and their modulation by each anti-Gal-3 treatment. Each column represents the mean relative gene expression levels of n = 11 (control) or n = 12 (HOCl, D11, E07, TD139) mice per group. Each gene is represented by one horizontal line. Gene expression intensities are displayed as colors ranging from blue for the lowest expression level to red for the highest expression level as shown in the key. The relative FC and FDR values are reported in Supplementary Data 3.

