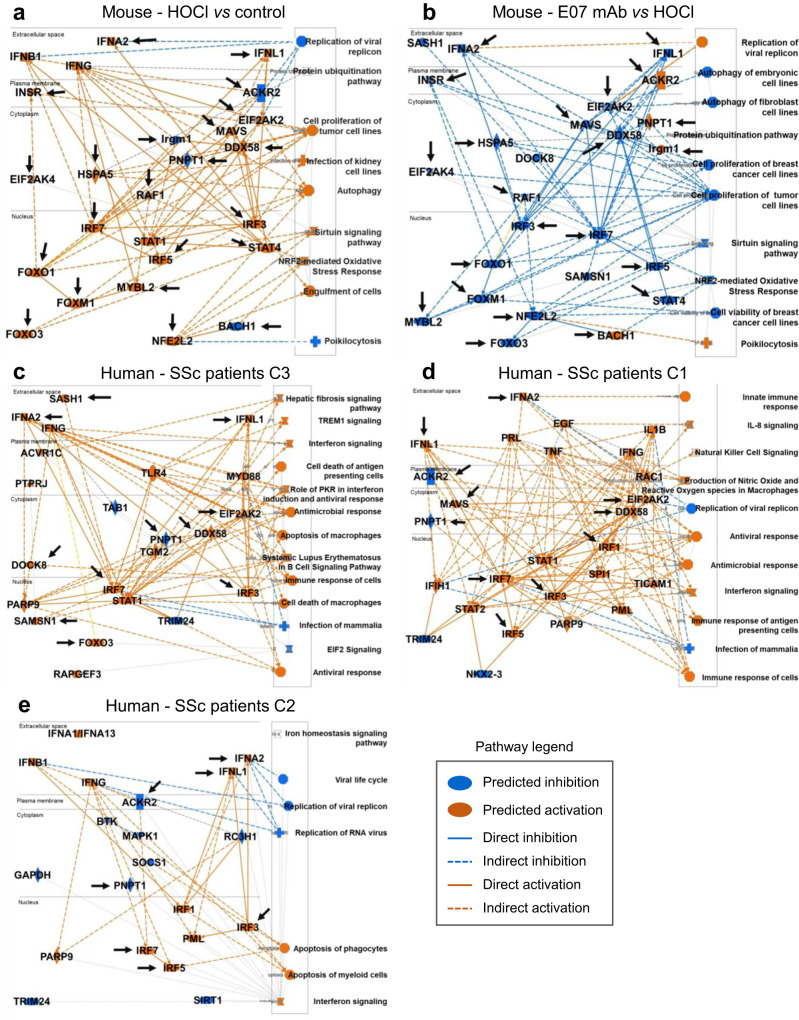
Fig. 7. Ingenuity pathway prediction analysis of Gal-3 entities modulated in the mouse model of HOCl-induced SSc and in patients with SSc.
a Prediction of entities modulated in HOCl-treated versus untreated control mice. b Prediction of entities modulated by E07 mAb treatment versus control HOCl-induced mice. Orange and blue colors indicate predicted activation or inhibition, respectively, as indicated in the key legend code. Black arrows in a and b indicate entities found in common and inversely modulated in both conditions. c–e Prediction of entities modulated in SSc patients of the PRECISESADS cohort. The three graphical summaries depict entities modulated in cluster 3 (c), 1 (d), and 2 (e), respectively. Black arrows in c–e indicate entities modulated in these patients and found to be inversely modulated by E07 mAb in the mouse model of HOCl-induced SSc (b).

