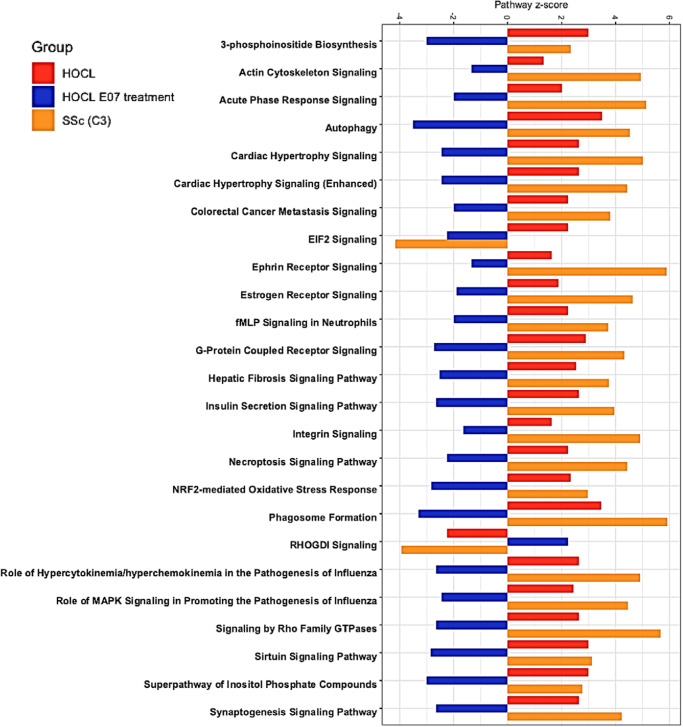
Fig. 8. Top 25 most representative canonical pathways modulated by E07 mAb in the mouse model of HOCl-induced SSc and in C3 SSc patients.
Horizontal bars represent z-score values for each canonical pathway (below 0, inhibited, above 0, activated) for each condition. Red, HOCl-induced mice versus untreated control mice; Blue, HOCl-induced mice versus HOCl-induced mice treated with E07 mAb; Orange, systemic sclerosis patients, cluster 3 versus healthy volunteers of the PRECISESADS cohort.

