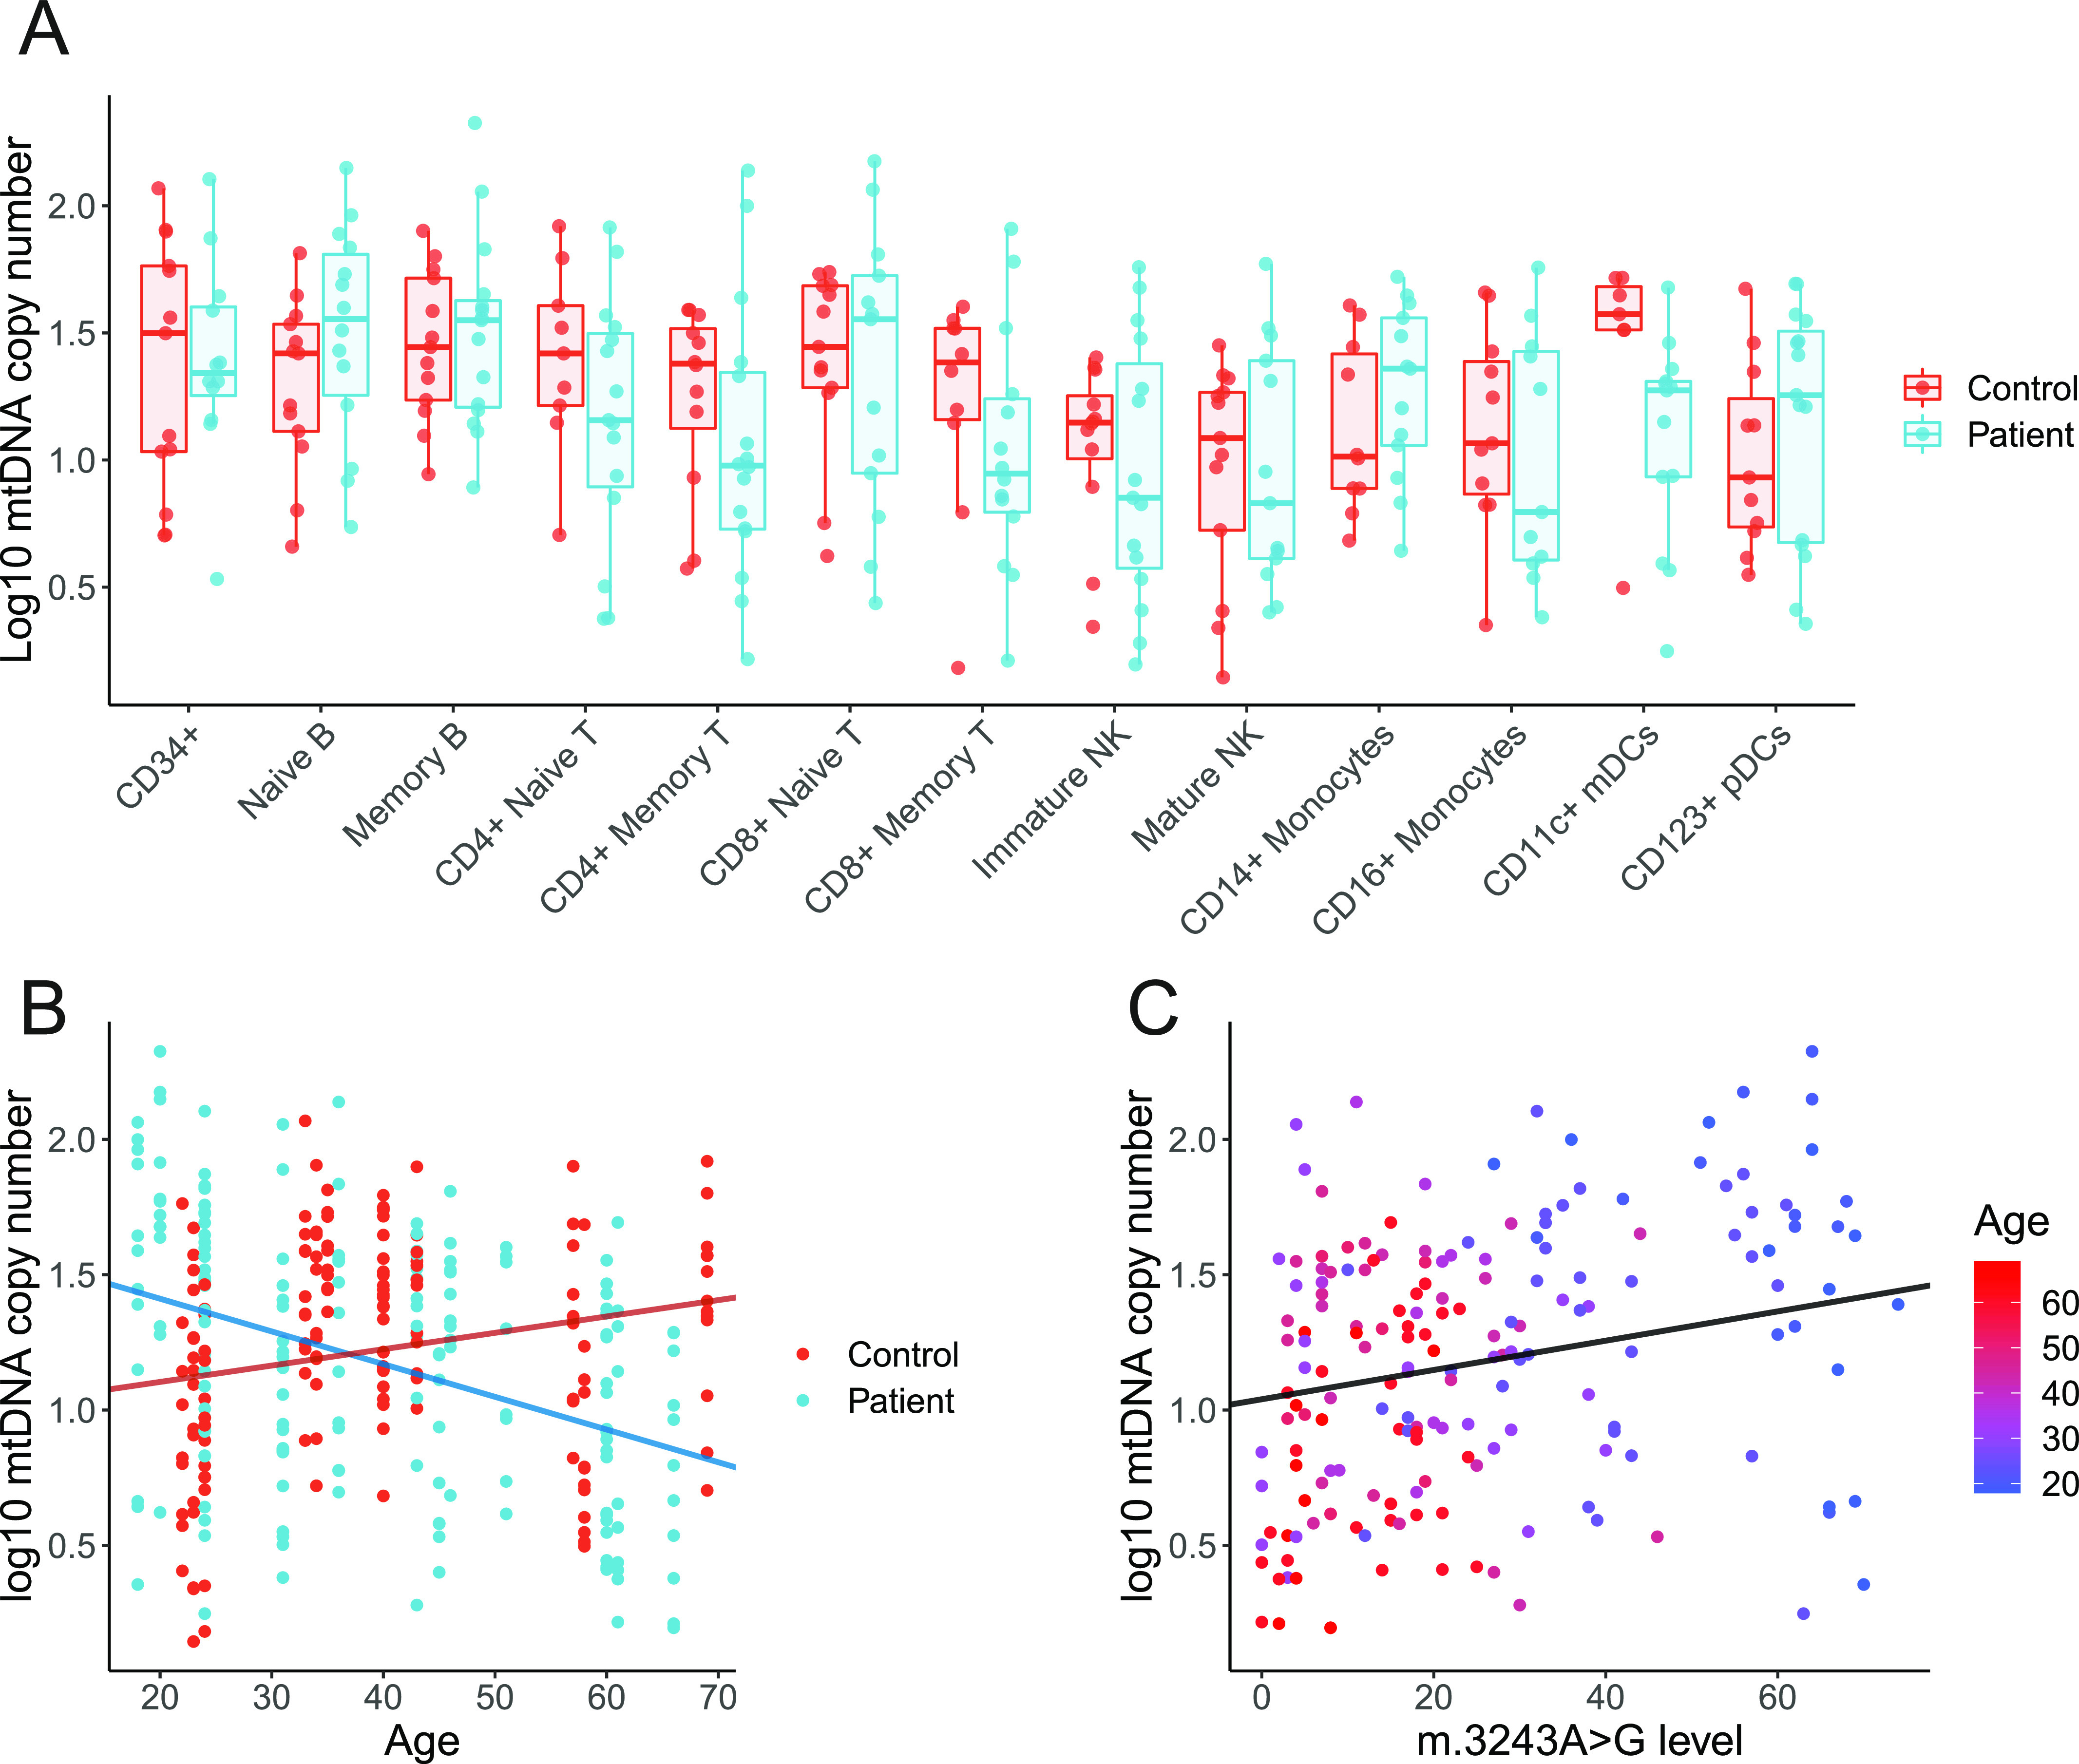
Figure 4. Mitochondrial DNA (mtDNA) copy number in bulk populations of peripheral immune cells.

Each point represents relative per cell mtDNA copy number derived from ∼1,000 cells from a population of cells, separated using flow cytometry, from a single individual. (A) Comparison of log mtDNA copy number between patients (blue; n = 16) and controls (red; n = 14). mtDNA CN is higher in controls than patients in CD11c+ mDCs (Wilcoxon test; P = 0.0186, false discovery rate adjusted = 0.2418) but not in other subsets (P > 0.05). (B) Age and log mtDNA copy numbers are negatively correlated in m.3243A>G patients (linear mixed model; β = −0.0121, SE = 0.0031, P = 0.0017) but not in controls (β = 0.0060, SE = 0.0046, P = 0.2133). (C) m.3243A>G level and log mtDNA copy number are weakly positively correlated (linear mixed model; β = 0.0054, SE = 0.0024, P = 0.0263). Points are coloured by age; as m.3243A>G level in the blood declines with age, the effect of age is difficult to distinguish from m.3243A>G level.
