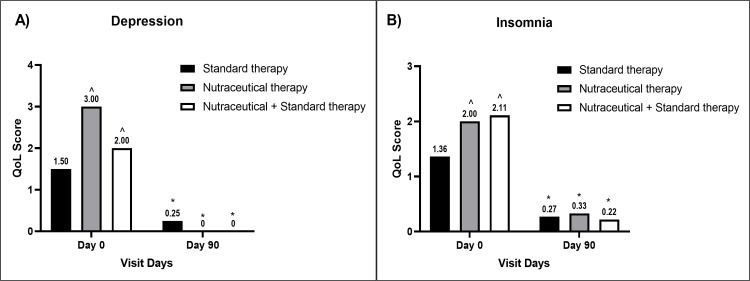
Figure 5. A bar diagram representation of improvement in QoL parameters of (A) depression (B) insomnia in the individual therapy group.
The data are presented as mean values. Within-group analysis was performed using one-way ANOVA with post hoc Dunnett’s multiple comparison test, and between-group analysis was performed using unpaired t-test analysis. *,^ indicates p<0.05 compared to the baseline value and p<0.05 compared to the standard therapy alone group, respectively.
QoL: quality-of-life; ANOVA: analysis of variance

