. 2023 May 19;21(9):933–946. doi: 10.1158/1541-7786.MCR-22-0820

Figure 3.

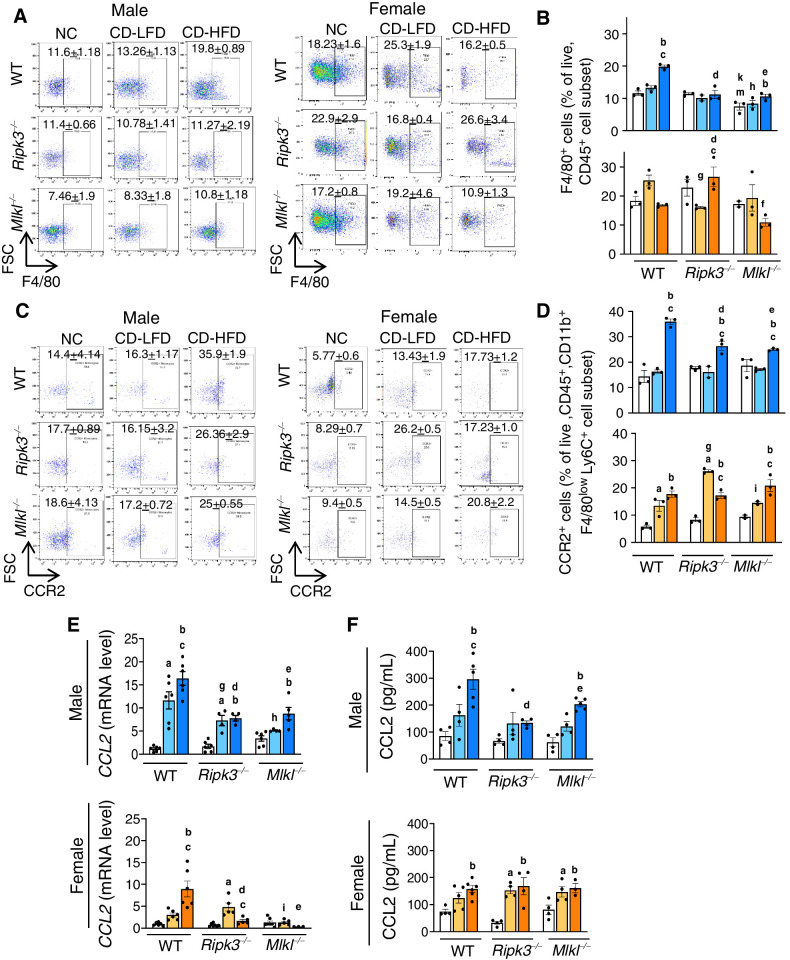
Figure 3. Deleting Ripk3 or Mlkl reduced CD-HFD–induced CCL2 and CCR2+ve macrophages. Left: Flow cytometric analysis of percentage of F4/80+ve cell population (A) and CCR2+ve cell population (C) in the livers of male (left) and female (right) mice. Right: Graphical representation of the percentage population of F4/80+ve cells gated on liver CD45+ve cell subset (B) and CCR2+ve cells, gated on liver CD45+, CD11b+, F4/80low, Ly6C+, Ly6G− cell subsets (D) in male (top) and female (bottom) mice. Transcript levels of hepatic CCL2 (E) and circulating CCL2 (F). Males: NC (white), CD-LFD (light blue) or CD-HFD (dark blue). Females: NC (white), CD-LFD (light orange) or CD-HFD (dark orange).

Deleting Ripk3 or Mlkl reduced CD-HFD–induced CCL2 and CCR2+ve macrophages. Left: Flow cytometric analysis of percentage of F4/80+ve cell population (A) and CCR2+ve cell population (C) in the livers of male (left) and female (right) mice. Right: Graphical representation of the percentage population of F4/80+ve cells gated on liver CD45+ve cell subset (B) and CCR2+ve cells, gated on liver CD45+, CD11b+, F4/80low, Ly6C+, Ly6G cell subsets (D) in male (top) and female (bottom) mice. Transcript levels of hepatic CCL2 (E) and circulating CCL2 (F). Males: NC (white), CD-LFD (light blue) or CD-HFD (dark blue). Females: NC (white), CD-LFD (light orange) or CD-HFD (dark orange).