. 2023 Jun 23;83(17):2938–2951. doi: 10.1158/0008-5472.CAN-22-2613

Figure 5.

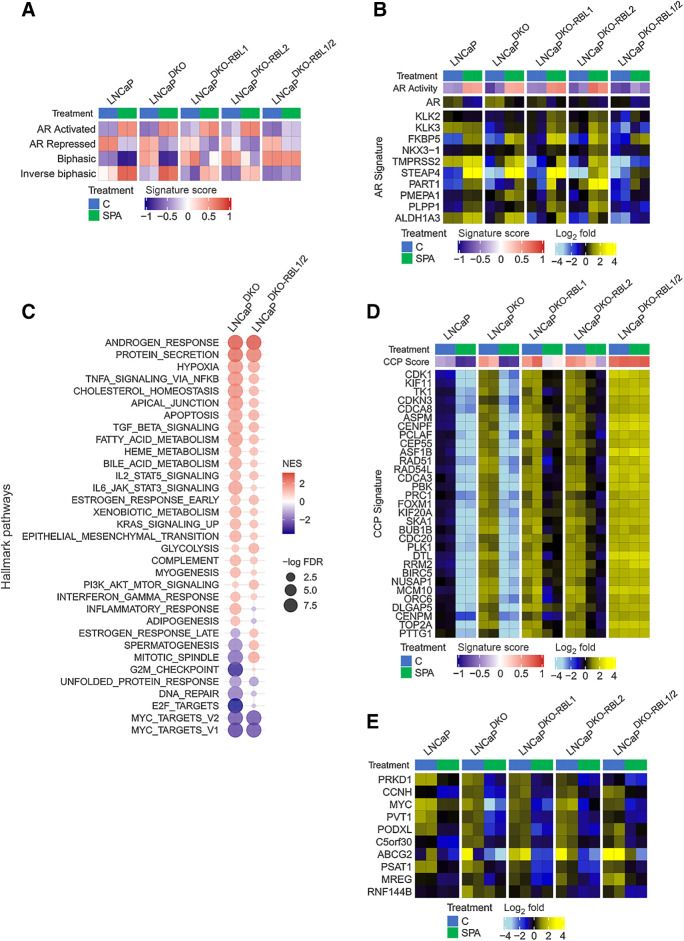
Figure 5. Androgen-mediated repression of cell-cycle genes is dependent on RBL1 and RBL2. A, GSVA signature score heatmaps of gene expression signatures on RNA-seq data generated from LNCaP models treated with SPA (10 nmol/L R1881) for 48 hours. B, Heatmap of mean-centered log2 (FPKM) RNA-seq values for the androgen-upregulated AR Activity signature genes. LNCaP and LNCaP-DKO data are replotted from Fig. 1. C, Plot of GSEA enrichment scores of MSigDB Hallmark gene sets representing SPA-induced gene expression changes in LNCaPDKO and LNCaPDKO-RBL1/2 cells. D, Heatmap of mean-centered log2(FPKM) RNA-seq values for the cell-cycle progression (CCP) signature genes. LNCaP and LNCaP-DKO data are replotted from Fig. 1. E, Heatmap of mean-centered log2(FPKM) RNA-seq values for the top 10 SPA-repressed genes in the LNCaPDKO-RBL1/2 cells. LNCaP and LNCaP-DKO data are replotted from Fig. 1.

Androgen-mediated repression of cell-cycle genes is dependent on RBL1 and RBL2. A, GSVA signature score heatmaps of gene expression signatures on RNA-seq data generated from LNCaP models treated with SPA (10 nmol/L R1881) for 48 hours. B, Heatmap of mean-centered log2 (FPKM) RNA-seq values for the androgen-upregulated AR Activity signature genes. LNCaP and LNCaP-DKO data are replotted from Fig. 1. C, Plot of GSEA enrichment scores of MSigDB Hallmark gene sets representing SPA-induced gene expression changes in LNCaPDKO and LNCaPDKO-RBL1/2 cells. D, Heatmap of mean-centered log2(FPKM) RNA-seq values for the cell-cycle progression (CCP) signature genes. LNCaP and LNCaP-DKO data are replotted from Fig. 1. E, Heatmap of mean-centered log2(FPKM) RNA-seq values for the top 10 SPA-repressed genes in the LNCaPDKO-RBL1/2 cells. LNCaP and LNCaP-DKO data are replotted from Fig. 1.