. 2023 Jun 16;83(17):2824–2838. doi: 10.1158/0008-5472.CAN-22-3682

Figure 1.

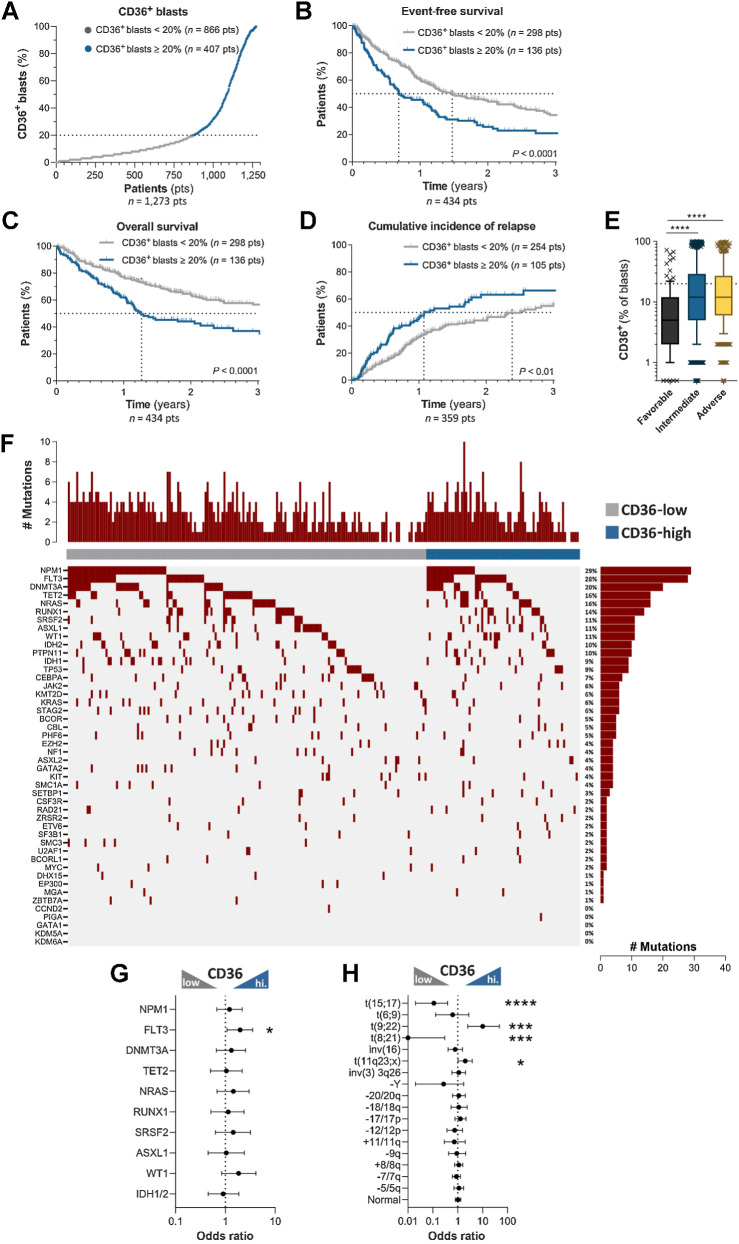
Figure 1. CD36 expression in blasts at diagnosis is associated with human AML progression and relapse. A, AML patients from the TUH cohort (1,273 patients) were classified as low and high CD36 expressers (CD36-expressing blasts <20%, low, n = 866 and CD36-expressing blasts ≥20%, high, n = 407). B, Kaplan–Meier curve for event-free survival according to CD36 expression (CD36 low, n = 298; CD36 high, n = 136). C, Kaplan–Meier curve for overall survival according to CD36 expression (CD36 low, n = 298; CD36 high, n = 136). D, Cumulative incidence of relapse according to CD36 expression (CD36 low, n = 254; CD36 high, n = 105). B–D, log-rank test. E, Box plot of CD36 expression on blasts according to cytogenetic risk (n = 1,191). Box plot shows the 10th percentile, first quartile, median, third quartile, and 90th percentile. Mann–Whitney test was performed. F, Landscape of somatic mutations detected in diagnostic samples (n = 224) by sequencing with a panel of 52 genes. The number of mutations for each patient is shown at the top, whereas the frequencies of each mutation are located at the right. G, Forrest plot showing mutation enrichment at AML diagnosis based on blast CD36 level by logarithmic odds ratio. Fisher exact test was performed (P  =  0.029 for FLT3). H, Forrest plot showing enrichment of recurrent cytogenetic anomalies at AML diagnosis according to CD36 expression by logarithmic odds ratio. Fisher exact test was performed (P < 0.0001 for t(15;17); P  =  0.0008 for t(9;22); P = 0.0002 for t(8;21); P = 0.044 for t(11q23;x)). The circles (in the middle of the error bars) represent the odds ratios. The error bars represent 95% confidence interval of the odds ratio. *, P < 0.05; ***, P < 0.001; ****, P < 0.0001.

CD36 expression in blasts at diagnosis is associated with human AML progression and relapse. A, AML patients from the TUH cohort (1,273 patients) were classified as low and high CD36 expressers (CD36-expressing blasts <20%, low, n = 866 and CD36-expressing blasts ≥20%, high, n = 407). B, Kaplan–Meier curve for event-free survival according to CD36 expression (CD36 low, n = 298; CD36 high, n = 136). C, Kaplan–Meier curve for overall survival according to CD36 expression (CD36 low, n = 298; CD36 high, n = 136). D, Cumulative incidence of relapse according to CD36 expression (CD36 low, n = 254; CD36 high, n = 105). B–D, log-rank test. E, Box plot of CD36 expression on blasts according to cytogenetic risk (n = 1,191). Box plot shows the 10th percentile, first quartile, median, third quartile, and 90th percentile. Mann–Whitney test was performed. F, Landscape of somatic mutations detected in diagnostic samples (n = 224) by sequencing with a panel of 52 genes. The number of mutations for each patient is shown at the top, whereas the frequencies of each mutation are located at the right. G, Forrest plot showing mutation enrichment at AML diagnosis based on blast CD36 level by logarithmic odds ratio. Fisher exact test was performed (P  =  0.029 for FLT3). H, Forrest plot showing enrichment of recurrent cytogenetic anomalies at AML diagnosis according to CD36 expression by logarithmic odds ratio. Fisher exact test was performed (P < 0.0001 for t(15;17); P  =  0.0008 for t(9;22); P = 0.0002 for t(8;21); P = 0.044 for t(11q23;x)). The circles (in the middle of the error bars) represent the odds ratios. The error bars represent 95% confidence interval of the odds ratio. *, P < 0.05; ***, P < 0.001; ****, P < 0.0001.