. 2023 Jun 16;83(17):2824–2838. doi: 10.1158/0008-5472.CAN-22-3682

Figure 6.

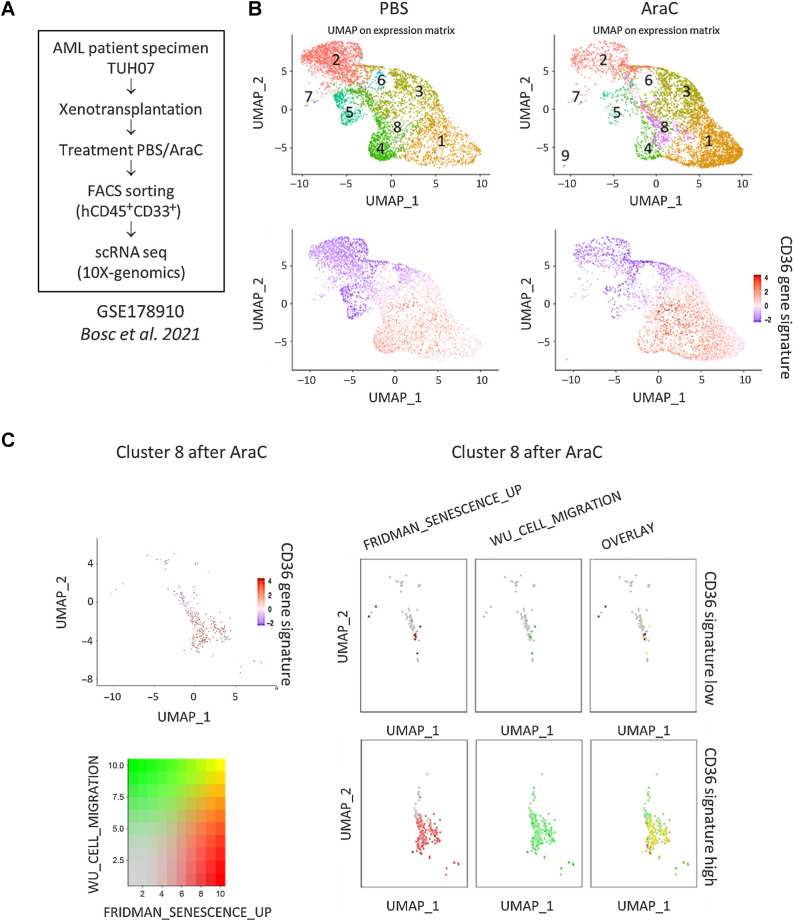
Figure 6. Single-cell transcriptomic analysis reveals enrichment of CD36-high, migration, and senescence-like gene signatures in a cluster emerging after standard chemotherapy. A, Schematic representation of the single-cell RNA-seq experiment performed on the TUH07 PDX previously published in Bosc et al. 2021 (GEO accession GSE178910; ref. 42). B, Uniform Manifold Approximation and Projection (UMAP) plot of 31,604 single cells from PDX TUH07 using Seurat. Colors indicate k-means clusters (k  =  9). C, Cluster 8 was isolated on the Seurat object and bifurcated into two groups “CD36-high” and “CD36-low” according to the enrichment level for the CD36 gene signature. Expression levels of gene sets related to senescence (FRIDMAN_SENESCENCE_UP) and migration (WU_CELL_MIGRATION) are shown.

Single-cell transcriptomic analysis reveals enrichment of CD36-high, migration, and senescence-like gene signatures in a cluster emerging after standard chemotherapy. A, Schematic representation of the single-cell RNA-seq experiment performed on the TUH07 PDX previously published in Bosc et al. 2021 (GEO accession GSE178910; ref. 42). B, Uniform Manifold Approximation and Projection (UMAP) plot of 31,604 single cells from PDX TUH07 using Seurat. Colors indicate k-means clusters (k  =  9). C, Cluster 8 was isolated on the Seurat object and bifurcated into two groups “CD36-high” and “CD36-low” according to the enrichment level for the CD36 gene signature. Expression levels of gene sets related to senescence (FRIDMAN_SENESCENCE_UP) and migration (WU_CELL_MIGRATION) are shown.