. 2023 Jun 16;29(17):3498–3513. doi: 10.1158/1078-0432.CCR-23-0219

Figure 3.

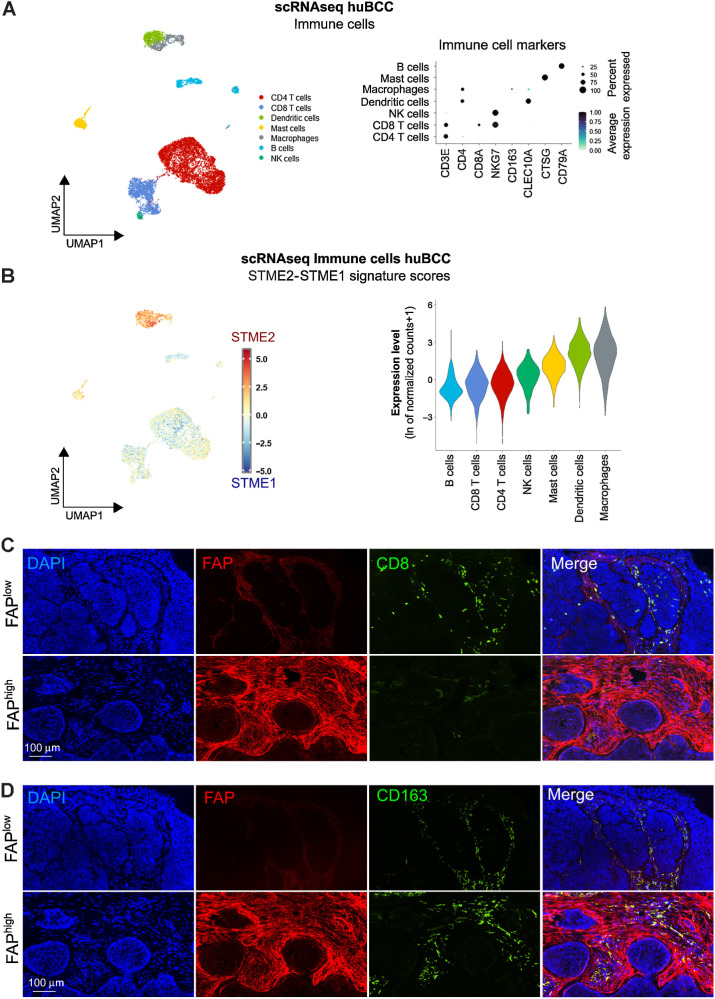
Figure 3. Immunosuppressive niches associated with ECM-remodeling CAFs are infiltrated with CD163+ macrophages but devoid of CD8 T cells. A, Subclustering of the Immune cells shown as a UMAP plot (left) and a dot plot of the average expression level of the immune marker genes (right). B, Average expression level of the difference between STME2 and STME1 signature scores in the Immune cells represented as a color scale overlaid UMAP plot (left) and violin plots (right). C, Representative images of a CD8 (green) and FAP (red) costaining on human BCC samples. Nuclei are stained with DAPI (blue). D, Representative images of a CD163 (green) and FAP (red) costaining on human BCC samples. Nuclei are stained with DAPI (blue). Bar scales in C and D indicate 100 μm.

Immunosuppressive niches associated with ECM-remodeling CAFs are infiltrated with CD163+ macrophages but devoid of CD8 T cells. A, Subclustering of the Immune cells shown as a UMAP plot (left) and a dot plot of the average expression level of the immune marker genes (right). B, Average expression level of the difference between STME2 and STME1 signature scores in the Immune cells represented as a color scale overlaid UMAP plot (left) and violin plots (right). C, Representative images of a CD8 (green) and FAP (red) costaining on human BCC samples. Nuclei are stained with DAPI (blue). D, Representative images of a CD163 (green) and FAP (red) costaining on human BCC samples. Nuclei are stained with DAPI (blue). Bar scales in C and D indicate 100 μm.