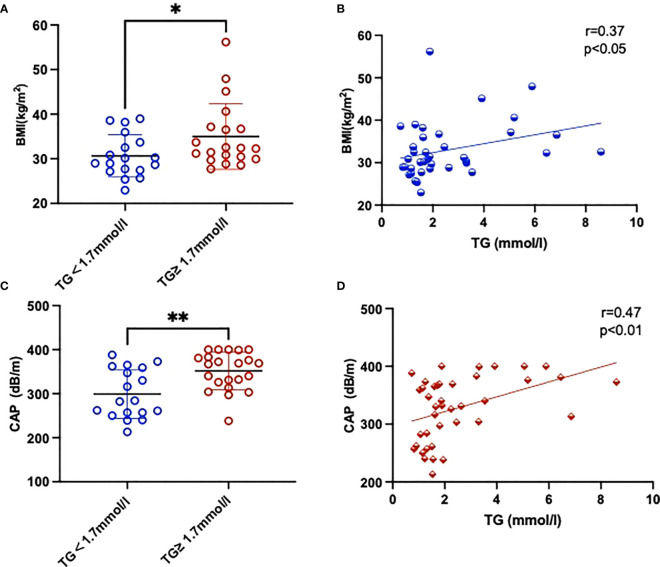
Figure 1.
Comparison of BMI (A) and CAP (C) parameters between two groups with and without high TGs. Also shown is the correlation between BMI (B), CAP (D) and TGs of the study. Results are shown as mean ± SEM. Statistics: (A, C) unpaired t-test/Mann-Whitney test, (B, D) Pearson/Spearman correlation. Significant changes are indicated as: *p < 0.05; **p < 0.01.

