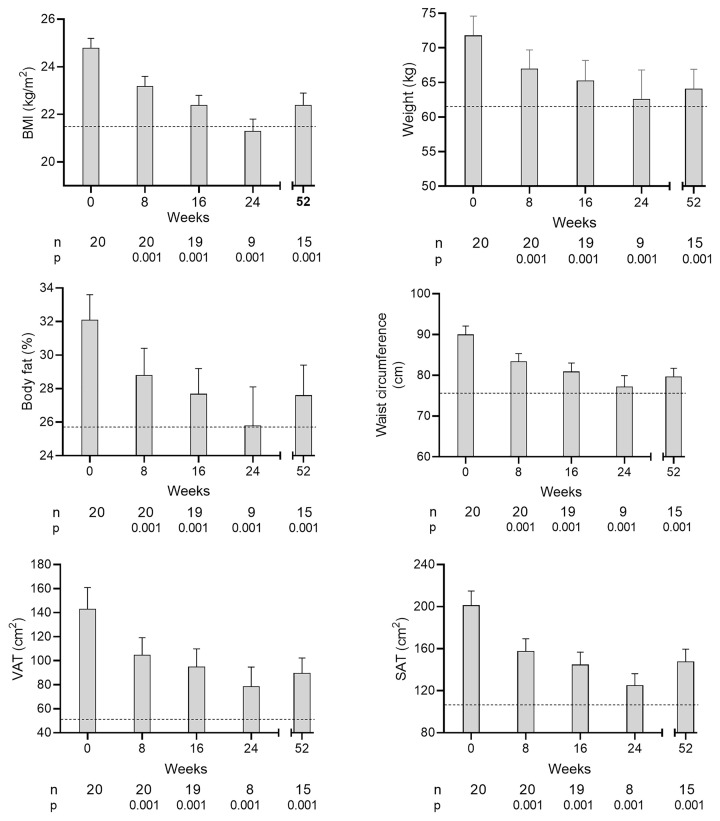
Figure 1. Time course of change in major clinical parameters after each cycle of weight loss and at 12 months.
Changes in mean (+SEM) BMI, weight, % body fat, waist circumference, visceral adipose tissue (VAT) and subcutaneous adipose tissue (SAT) in the T2D group during the intervention at each time point. Numbers of participants and level of statistical significance vs. baseline are shown below each time point. The dotted line shows the mean control values for each parameter.

