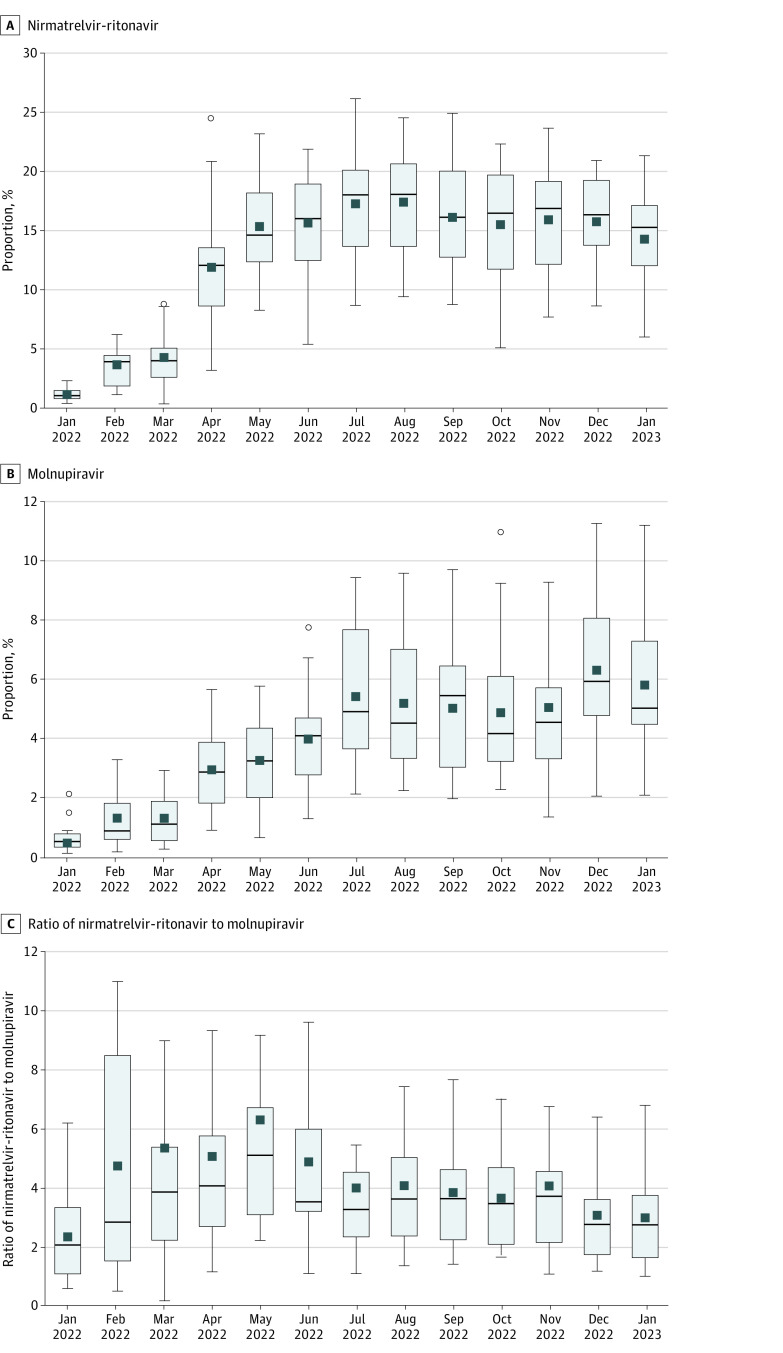
Figure 3. Distribution of Pharmacotherapies Across Veterans Integrated Services Network (VISN).
COVID-19 pharmacotherapies across the 18 VISNs are presented by month. Boxes indicate IQRs; circles, outliers; horizontal lines, medians; squares, means; whiskers, 1.5 × the IQR. Outliers are shown in A and B but omitted in C.

