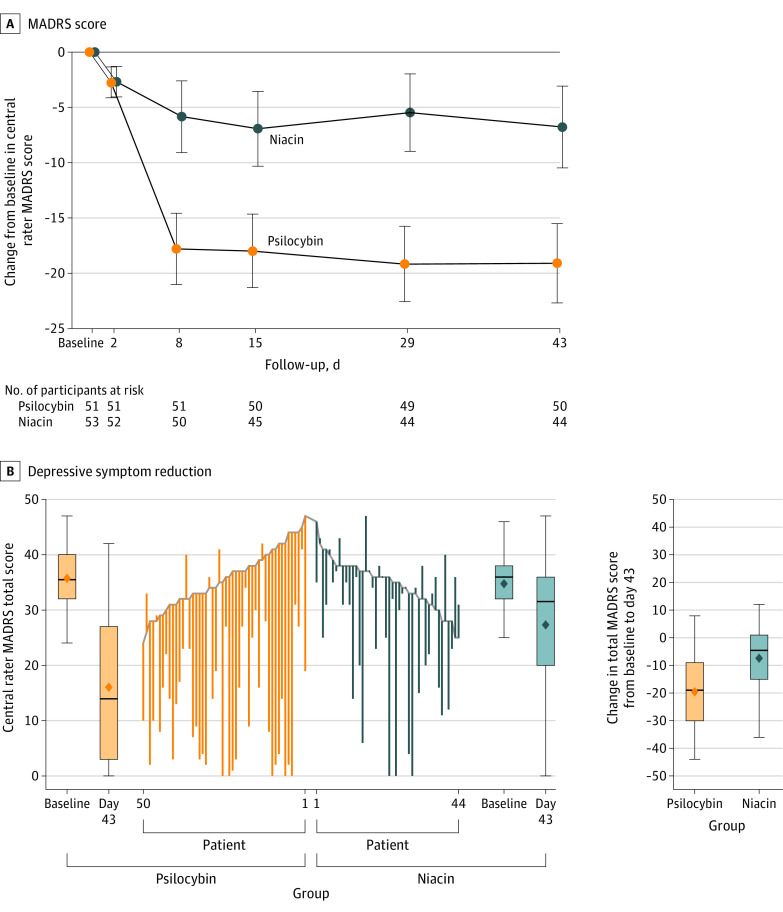
Figure 2. Change in Montgomery-Asberg Depression Rating Scale (MADRS) Score by Treatment Group.
A, Results from mixed model for repeated measures adjusted for baseline score, site, sex, and treatment-resistant depression. Error bars represent 95% CIs; point labels are P values for treatment difference for primary (day 43) and key (day 8) secondary end points in the intent-to-treat population. B, Raw value participant change values with means indicated with diamonds and medians indicated by the bar in the boxes. The boxes show the IQR and the whiskers extend from the boxes to indicate the most extreme point that is less than or equal to 1.5 times the IQR. See eFigure 2 in Supplement 3 for additional details.

